Markov Models in TreeAge Pro
Create your Markov model quickly and easily with TreeAge Pro’s Markov Model Wizard and Visual Editor.
TreeAge Pro calculates your model automatically based on its design and inputs.
Validate disease progression with TreeAge Pro’s transparent reporting and visualization tools.
Our Markov framework seamlessly integrates with a robust set of health economic analysis tools.
Share your models with clients and colleagues.
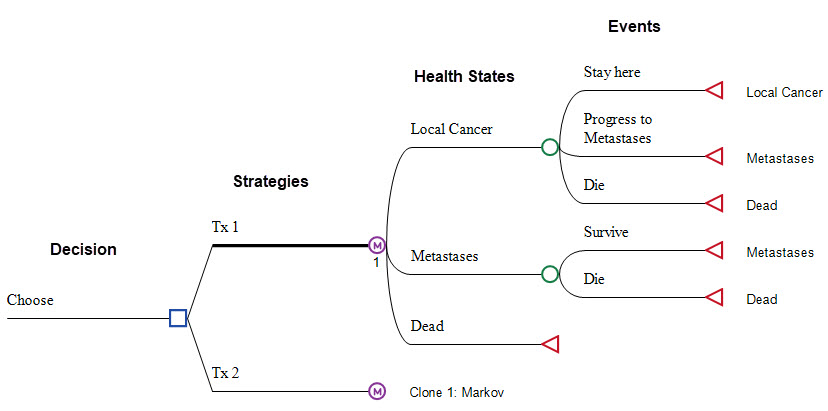
Build your Model Structure
Health States and Event Pathways
Add health states and events directly to your model using the visual editor.
Use the Markov Model Building Wizard to build the main structure in a few easy steps.
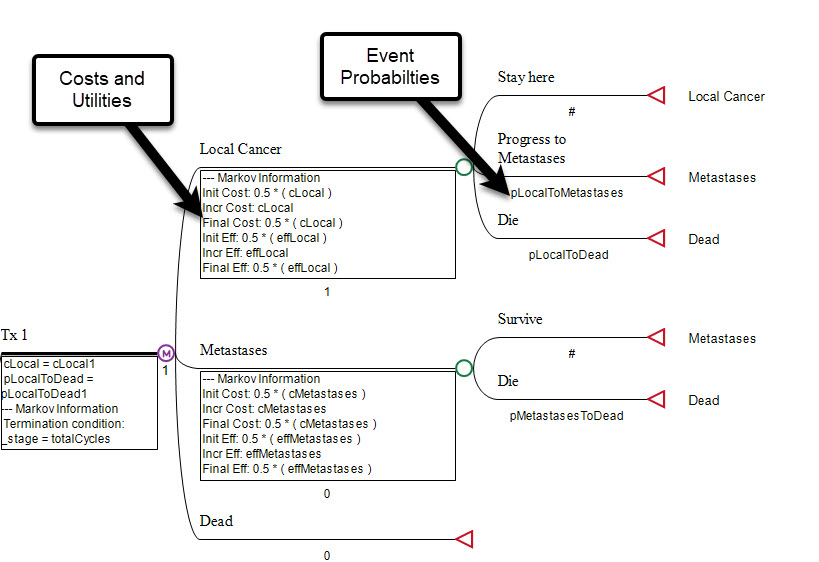
Add Values to the Model Right Where They’re Needed
Add Event Probabilities
Enter event/transition probabilities directly into the Markov model framework to define disease progression over time.
Model changing risk with our sophisticated Hazard tools.
Incorporate heterogeneity and patient history to impact disease progression using Markov Simulation Models.
Add Costs and Utilities
Add costs and utilities at any health state and at any event to account for medication, procedure, testing and any other healthcare costs.
Include additional model outcomes (progressions, deaths, screenings, procedures, etc.) to provide a more in-depth understanding of your model results.
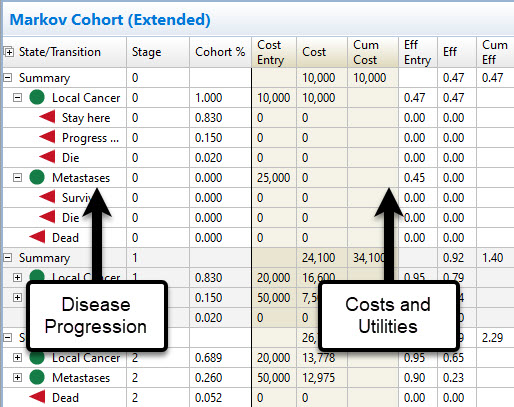
TreeAge Pro Handles the Calculations
Markov Model Calculations & Reporting
Your health states, events, probabilities, costs and utilities are seamlessly integrated into model calculations. This generates the average cost and utility per patient, which can then be used in Cost-Effectiveness Analysis.
Markov Cohort Reports provide cycle-by-cycle, event-by-event details on disease progression, cost and utility.
Built-in functions handle half-cycle correction and discounting within the Markov process.
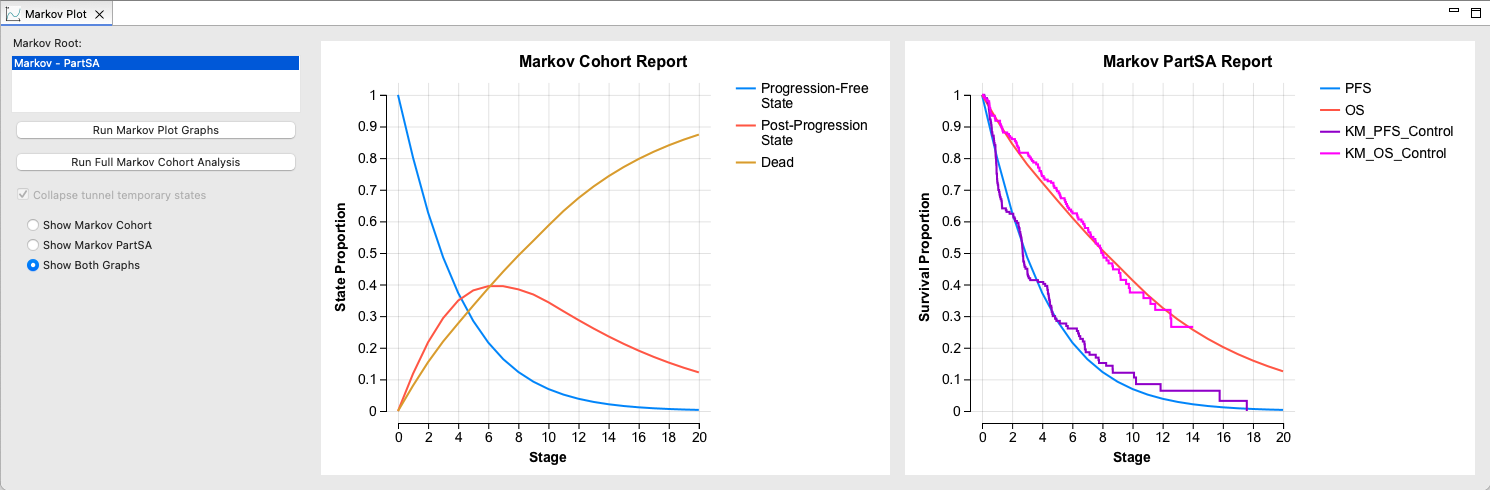
Markov Plot
Use the Markov Plot to compare disease progression in your model with clinical Kaplan-Meier survival curves.
Refine your assumptions and regenerate the plot with a single click.
Integrate with TreeAge Pro analysis tools
Extend your Markov model with additional analysis tools required for a robust modeling research project.
- Cost-Effectiveness Analysis to compare strategies
- Sensitivity Analysis/Tornado Diagrams to assess parameter uncertainty
- Probabilistic Sensitivity Analysis (PSA) to assess overall uncertainty
- Patient Simulation to integrate patient-specific characteristics and history into the model
Additional modeling and sharing tools
Use our extensive toolkit to build accurate models quickly and share them with colleagues.
- Markov Model Wizard to quickly build your model structure
- Markov Plot to validate disease progression against clinical data
- Markov to Excel Conversion to share your model in Excel
- Share Models on the Web so colleagues can review/analyze your model
- Hazard Functions to use clinical data to derive event probabilities
State Transition Diagrams
State Transition Diagrams are a simpler representation of a Markov model in TreeAge Pro. TreeAge Pro allows you to convert from one format to the other.
Particularly for communication and publishing, you may want to present your model as a State Transition Diagram.
Markov Model Webinar
Watch this webinar to see the full extent of Markov modeling tools in TreeAge Pro, including the seamless integration with reporting and analysis.
Helpful Markov Modeling Tutorials
What is a Markov Model and why are they used for health economics?
Markov models, also known as state transition models, allow you to represent disease progression over time in a clear and consistent framework to make well-informed healthcare decisions.
For example, you might be modeling cancer progression over time. Markov models handle this seamlessly with a framework of health states and events. Patients start each cycle in a health state, then pass through event patient pathways within a time cycle, resulting in a different distribution of patients among the health states to start the next cycle. This allows a relative simple set of progression, death and other events to occur for different patients at different times in the future.
While the patients pass through the health states and events, they accumulate costs and utilities. Costs for chronic care management and health utility are accumulated at each health state as patients progress. Costs may also be accumulated for critical events like procedures, hospitalizations and screening tests.
Markov Cohort Analysis accumulates the various costs and utility based on the percentage of the overall patient cohort that passes through these health states and events. The resulting sum of all weighted cost/utility values for all cycles generates the average cost/utility per patient. The average values per patient can then be compared to other treatment/diagnosis strategies to determine the most cost-effective option.
Markov models are also referred to as Markov chain model, state transition models and Markov tree diagrams.