Partitioned Survival Analysis
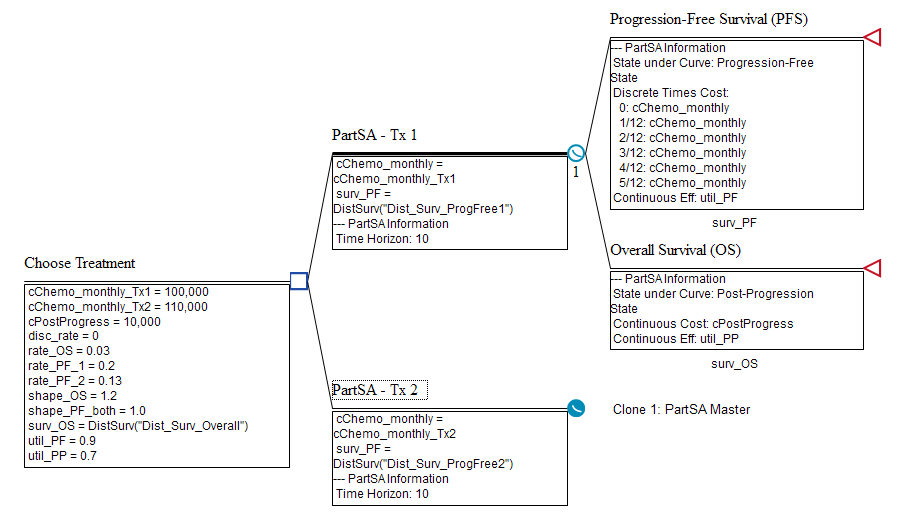
PartSA models map disease progression directly from survival data
Model state membership directly from survival data
Survival curve nodes support survival and hazard functions.
Easily accumulate cost & utility based on state membership over time.
Use the Familiar TreeAge Pro Model Structure
Visual model editing and built-in tools make it easy to start with new modeling techniques.

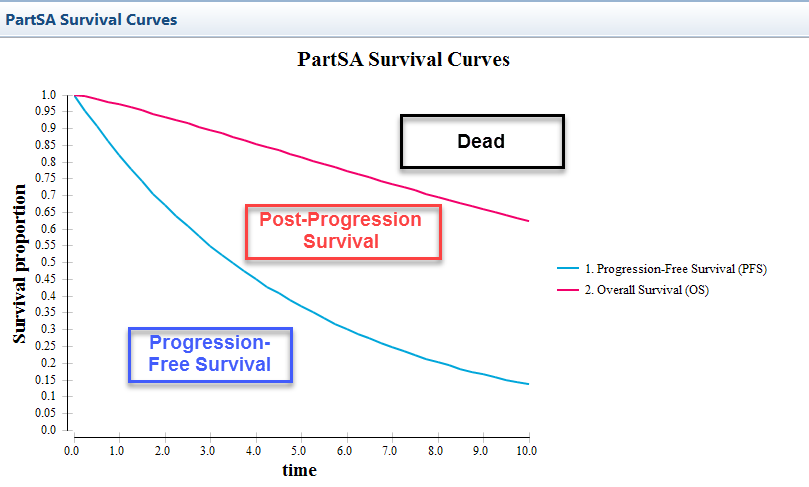
Generate Survival Curve graph
Visualize survival over time. Cost and utility are automatically calculated from the underlying survival curves.

Built-in TreeAge Pro Analyses
Run the same analyses you already use for decision trees and Markov models – Cost-Effectiveness Analysis, Tornado Diagrams, Probabilistic Sensitivity Analysis and more.
