21.5 Graph Axis Controls
All graphs include controls for the x-axis and y-axis. These controls include range (min to max), interval size and numeric formatting.
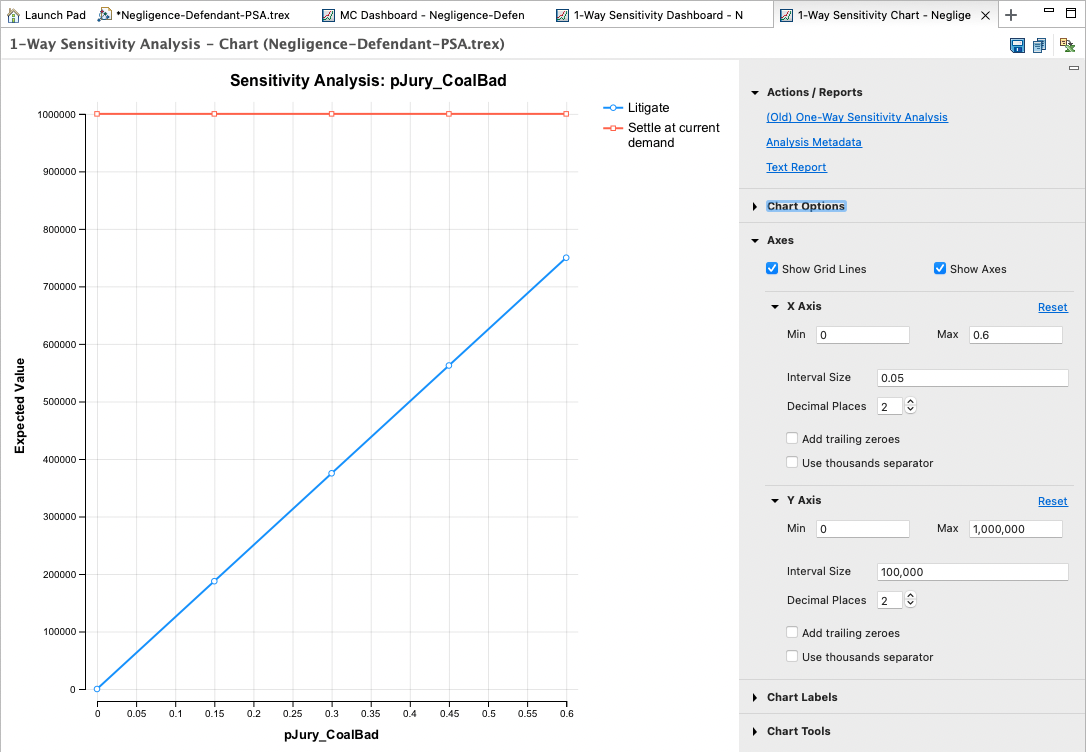
Y-axis options include controls to show values on a log scale (typically for survival graphs) and as percentages (for probabilities).
