8.7 Probability Distribution Graph
Probability Distribution Graphs shows a range of output values for a strategy. Similar values are consolidated into bins represented by bars. The height of each bar indicating how likely the strategy is to be in that bar's range.
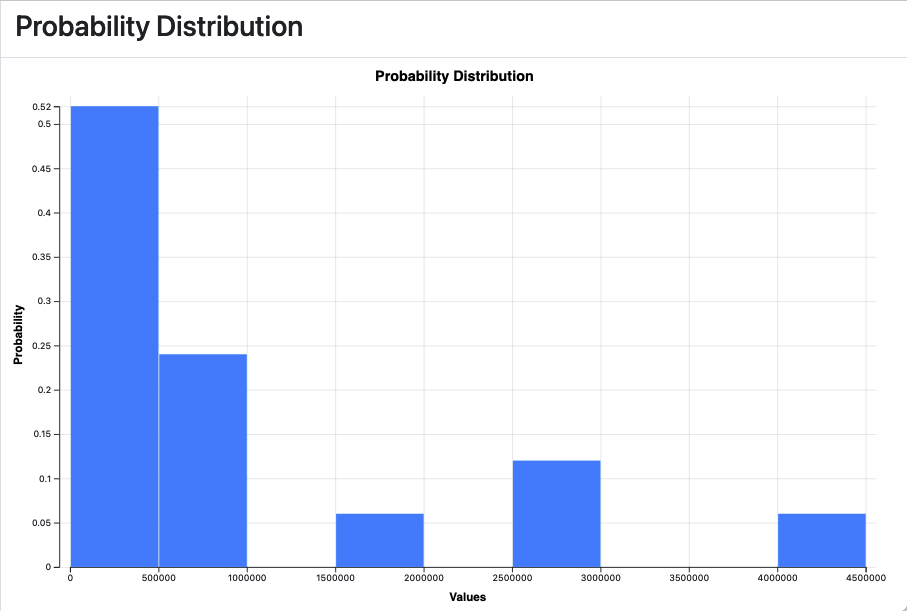
The most likely outcome value for this strategy is between 0-500,000. Note that multiple pathways can contribute to values in that range.
