58.10 Cost-Effectiveness Analysis
Cost-Effectiveness Analysis (CEA) compares strategies with the goal of minimizing cost and maximizing health outcomes. CEA will recommend a more expensive strategy only if it can be justified by sufficiently better health outcomes.
A key metric for strategy comparison is the Incremental Cost-Effectiveness Ratio (ICER).
-
ICER = Incremental Cost / Incremental Effectiveness for a pair of strategies.
-
If ICER is less than the Willingness to Pay (ICER < WTP), then we recommend the more expensive, more effective strategy.
-
This standard can be applied to each pair of strategies in ascending cost order. Do not continue to the next strategy if the ICER > WTP.
Another metric for strategy comparison is Net Monetary Benefits (NMB).
-
NMB = Effectiveness * WTP - Cost
-
From among a set of competing strategies, the one with the highest NMB is the most cost-effective.
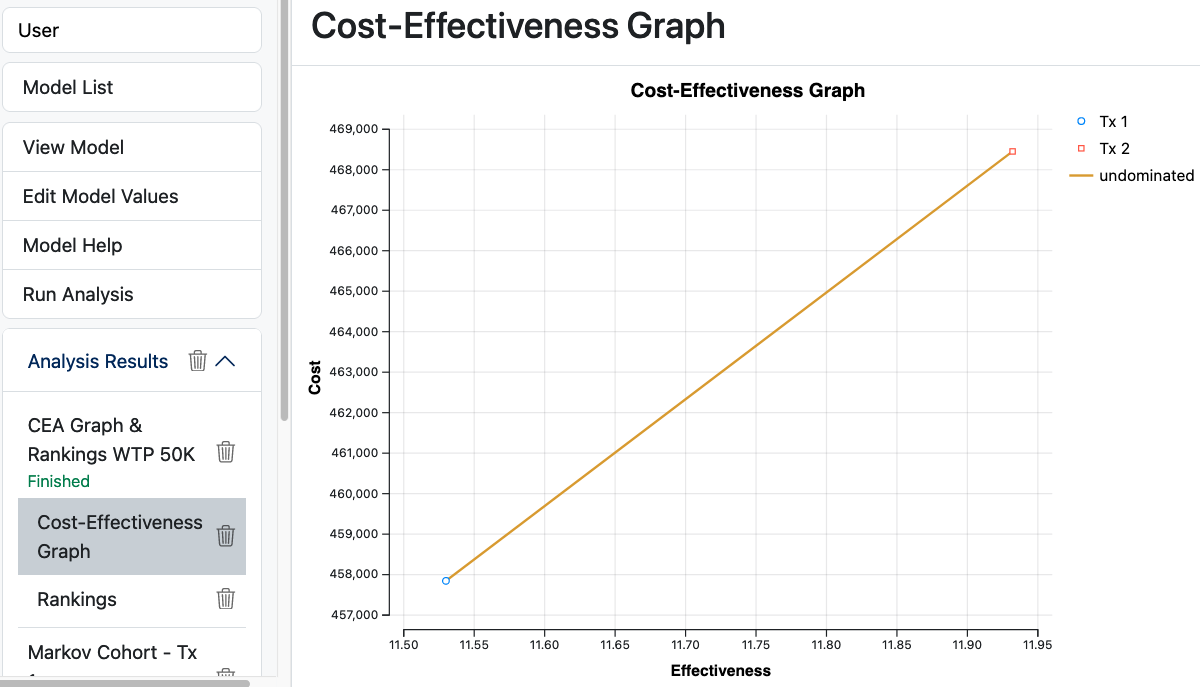
In TPWeb, Cost-Effectiveness Analysis is a graph with cost on the y-axis and effectiveness on the y-axis. Line segments that connect each pair of possibly optimal strategies have slopes equal to the ICER.
A Cost-Effectiveness Graph in TPWeb is presented below.
Optionally, the Rankings report can be included as a second output from Cost-Effectiveness Analysis. The Rankings report is presented below.
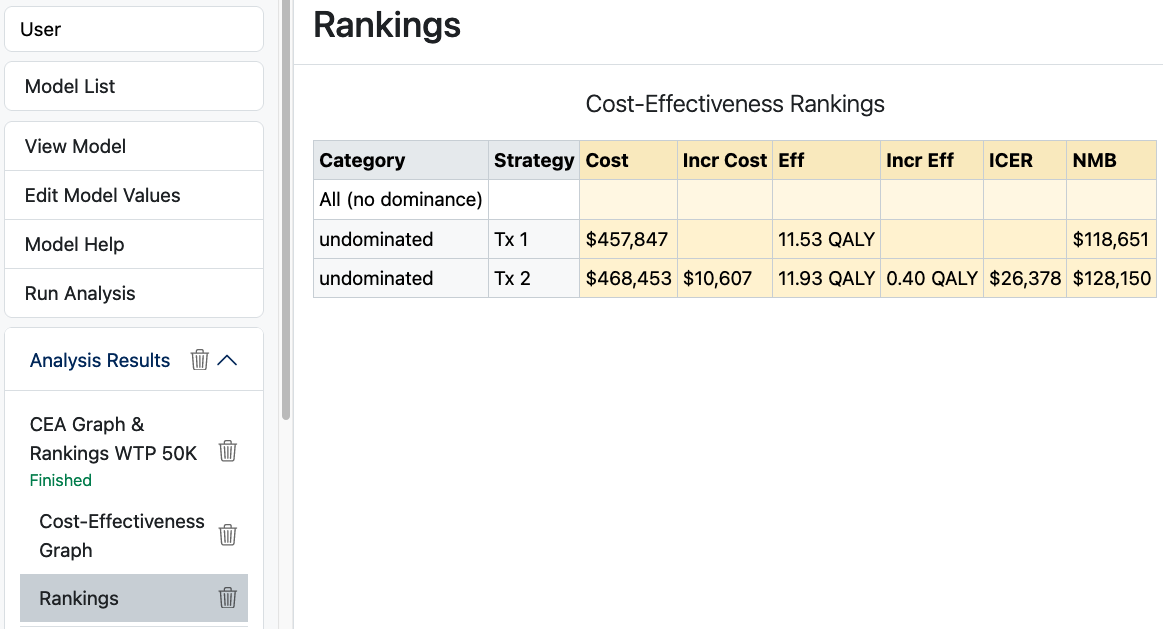
Note the ICER is less than a WTP of $50K, so Tx 2 would be the optimal strategy. Tx 2 also has a higher NMB.
Note that a modeler may share a Rankings analysis instead of Cost-Effectiveness Analysis, in which case only the Rankings report would be available. This would be done for models that are not setup as cost-effectiveness models.
