7.3 Identifying the Optimal Strategy
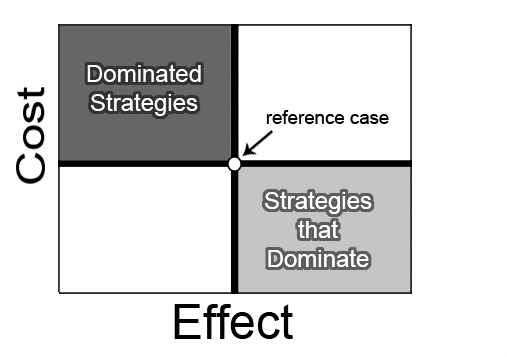
In a cost-effectiveness analysis, sometimes a strategy can be eliminated based on its relative cost and effectiveness compared to another strategy. An option is said to be dominated if it both costs more and is less effective than a comparator. This condition can be visually identified in a cost-effectiveness graph.
When effectiveness is plotted on the X-axis, a strategy is absolutely dominated if it lies above and to the left of another alternative. The option below and to the right is referred to as dominant, or dominating. TreeAge Pro shows dominated strategies in the graph, but they will not be displayed on the cost-effectiveness frontier.

In the CE graph for the CE Decision Tree, neither Treatment is dominated. They both lie on the CE frontier.
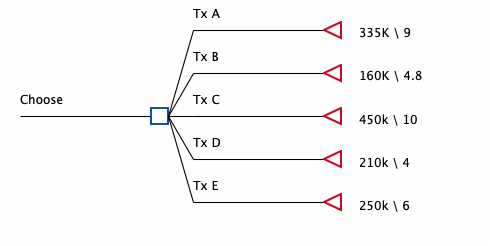
The Health Care tutorial example model, Extended Dominance, represents the cost and effectiveness of five strategies. The tree has been set up to only illustrate special dominance conditions - comparing example treatments A to E.

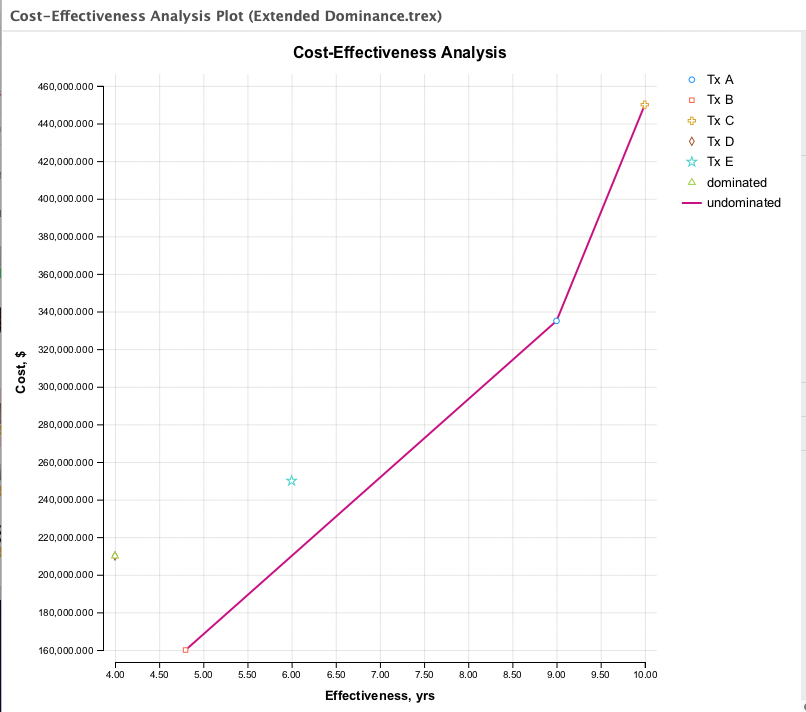
The CE graph from this Extended Dominance tree is shown below.

By default, extended dominance lines are not shown, however, there is an option to show them.
Tx D is the only option removed from the cost-effective frontier based on absolute dominance — it is more costly and less effective than Tx B, the least costly option. The cost-effective frontier is defined starting with Tx B, skipping Tx E, continuing to Tx A, and then to Tx C (the most costly and most effective option).
Why is strategy Tx E excluded? TreeAge Pro has flagged Tx E as being not cost-effective due to extended dominance. Interpreting special conditions of extended dominance in a CEA requires an understanding of the related concept of incremental cost-effectiveness ratios (ICERs).
Extended dominance lines can be shown by checking the "Show Extended Dominance" box in the CE graph options.
Extended dominance and ICERs
A single cost-effectiveness analysis for a particular health condition takes place within a wider context; providing the best range of treatments and prevention is the goal, but financial, human, and other resources eliminate some options.
In CEA, when comparing two non-dominated options, an incremental cost-effectiveness ratio (ICER) is calculated. The ICER of the more effective option is the ratio of the mean incremental cost and mean incremental effectiveness (e.g., in terms of $/QALY). Graphically, it is the slope of the line connecting two, cost-ordered strategies.
ICER = IC / IE
ICERs are used in the CEA process in a couple of ways. First, ICERs are used to determine whether options can be removed from the cost-effective frontier based on extended dominance. Lower ICERs correspond to better value (i.e., lower cost per unit of additional effectiveness). As shown in the graph, Tx A is more effective than Tx E and has a lower ICER (slope decrease). Thus, the cost-effective frontier connects Tx B and Tx A, but skips Tx E, based on extended dominance.
With effectiveness on the horizontal axis, the slope of the line segment connecting two options corresponds to the ICER. Slopes approaching a horizontal orientation correspond to better (lower) ICERs. In graphs on the previous page, it can be seen that Tx A is more effective than Tx E, and also has a lower ICER than Tx E. In other words, Tx A is a better value than Tx E, relative to Tx B.
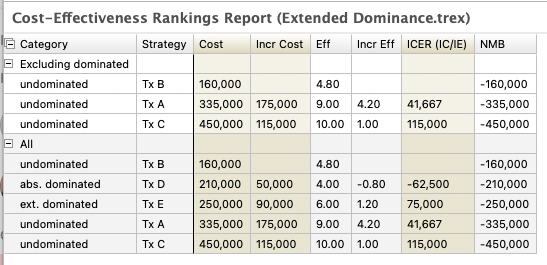
In addition to the visual indication of extended dominance provided in the CE graph, the text report provides details about conditions of extended dominance.

Let's look at the CE Text Report in more detail. The collapsible groups are listed below.
-
Excluding dominated: Only undominated strategies.
-
All options: All strategies ordered from least costly to most costly.
Note it is possible to show two additional groupings in the Rankings report by changing Tree Preferences - All Referencing a Common Baseline and Order by Increasing Effectiveness. These are typically not helpful for interpreting CE results, so they are hidden by default.
The columns in the Text report include:
-
Category: Indicates whether a strategy is dominated (and if so, how).
-
Strategy: The node label for the strategy (branch of the decision node).
-
Cost: Average cost value for the strategy.
-
Incr Cost: Incremental cost as the difference in cost between this strategy and the previous less costly strategy on the CE frontier (excludes dominated strategies).
-
Eff: Average effectiveness value for the strategy.
-
Incr Eff: Incremental effectiveness as the difference in cost between this strategy and the previous less costly strategy on the CE frontier (excludes dominated strategies).
-
ICER (IC/IE): The incremental cost-effectiveness ratio (incremental cost divided by incremental eff) comparing this strategy to the previous less costly strategy on the cost-effectiveness frontier (excluding dominated strategies).
-
NMB: Net monetary benefits as calculated from the cost and effectiveness for the strategy and the willingness-to-pay (WTP) for the tree. The highest value indicates the favored strategy for the given WTP. More information about the NMB can be found in the next section.
All incremental values including ICERs are calculated using only the strategies on the cost-effectiveness frontier, excluding all dominated strategies. Therefore, we will focus on the undominated group. The undominated strategies are sorted from least costly to most costly: Tx B, Tx A, Tx C. Incremental values are then calculated for each strategy as compared to the previous less costly strategy.
For Tx A compared to Tx B...
ICER = IC / IE = ( 335K - 160K ) / (9 - 4.8) = 175K / 4.2 = 41,667
For Tx C compared to Tx A...
ICER = IC / IE = (450K - 335K) / (10 - 9) = 115K / 1 = 115K
In the undominated group, the ICERs will always increase as you move to more costly options. When the ICER decreases in the all group, then this indicates that the previous strategy is dominated via extended dominance.
Note that the ICER for Tx E is larger than the ICER for Tx A, which eliminates Tx E from the cost-effectiveness frontier due to extended dominance. This indicates that it would be a more efficient use of resources to switch from Tx B to Tx A than it would be to switch from Tx B to Tx E.
The threshold ICER (or willingness-to-pay, or ceiling ratio)
The next way in which the ICER is used is to determine if, at some point on the cost-effective frontier, the next more effective option exceeds a threshold ratio, sometimes referred to as the willingness-to-pay, or ceiling ratio. To efficiently allocate resources among competing priorities, there is normally a limit to the additional cost per unit of effectiveness gained – i.e., the ICER – that a rational decision maker will accept to move up the frontier.
If the decision maker assumed a threshold ICER of 40,000, for example, then tx A would exceed this — it might be considered slightly inefficient (too costly per unit of effectiveness gained).
The Sensitivity Analysis on Cost-Effectiveness Models Chapter (Coming soon!) continues the discussion of CEA thresholds in the context of sensitivity analysis in TreeAge Pro.
Extended dominance: an additional perspective
In some cases, strategy selection may involve not just maximizing effectiveness and working within a threshold ICER, but also working under a budget constraint (i.e., a cost threshold). If such a cost ceiling were set at $300K, this would eliminate Tx A because the cost exceeds the cost ceiling.
Theoretically, if a decision maker is making a population-wide policy decision, two (or more) strategies might be combined to create a “blended” strategy that is less expensive (and less effective) than the too costly option. For example, instead of assigning Tx A to all patients, they could be randomly assigned in some proportion to Tx A and Tx B. In the CE graph, this would result in a new strategy somewhere on the line connecting the two strategies.
The line connecting two options in the graph represents the average cost and effect for all possible blends of the two treatments. The intersection of the ICER line with the cost ceiling (a horizontal line) represents the best hypothetical option blending of Tx A and Tx B. This optimal blend point is represented as k calculated as the ratio:
(Cost A - Cost_Ceiling ) / (Cost A - Cost B )
The interpretation is that k% of patients treated are given the less effective Treatment B instead of Tx A (or all patients are given Tx B for k% of their treatments, and Tx A the rest of the time). However, questions of equity mean that blends are not often relevant.
The other aspect of the concept of blending, and the blend line, is related to the extended dominance concepts discussed in the previous section. If a blended strategy is created, it may cause an extendedly dominated strategy to become an absolutely dominated one. In the extended dominance example on previous pages, some hypothetical blends of Tx A and Tx B would absolutely dominate Tx E.
