7.4 Net Benefits Calculations
The calculation of net monetary benefits (NMB) and net health benefits (NHB) is increasingly prevalent in health economic evaluations, either in addition to or sometimes instead of using ICERs.
In essence, the Net Benefits calculations combine cost, effectiveness and willingness-to-pay into a single measurement. The strategy with the highest Net Benefit is the most cost-effective given the fixed willingness-to-pay parameter.
Willingness-to-pay (WTP) represents how much you are willing to pay for an additional unit of effectiveness. In cost-effectiveness analysis, this is compared to the incremental cost-effectiveness ratio (ICER) to determine if a more expensive treatment should be considered cost-effective. Willingness-to-pay is a weight on effectiveness in Net Benefits calculations.
The net monetary benefit (NMB) of an alternative is calculated using the following formula:
NMB = E * WTP - C
where E represents effectiveness, C represents cost, and WTP is the willingness to pay (i.e., the decision maker’s threshold ICER).
The net health benefit (NHB) of an alternative is calculated using a similar formula:
NHB = E - C /WTP
Some advantages of using net benefits:
Regardless of the number of strategies, the most cost-effective comparator is simply the one with the highest net benefit, given a threshold ICER (“WTP” in TreeAge Pro).
When trying to describe uncertainty in CE models with small mean differences in effectiveness (or many competing alternatives), net benefit calculations are not unstable as ratios like the ICER can be.
Net benefits are the basis for acceptability curves and value of information curves.
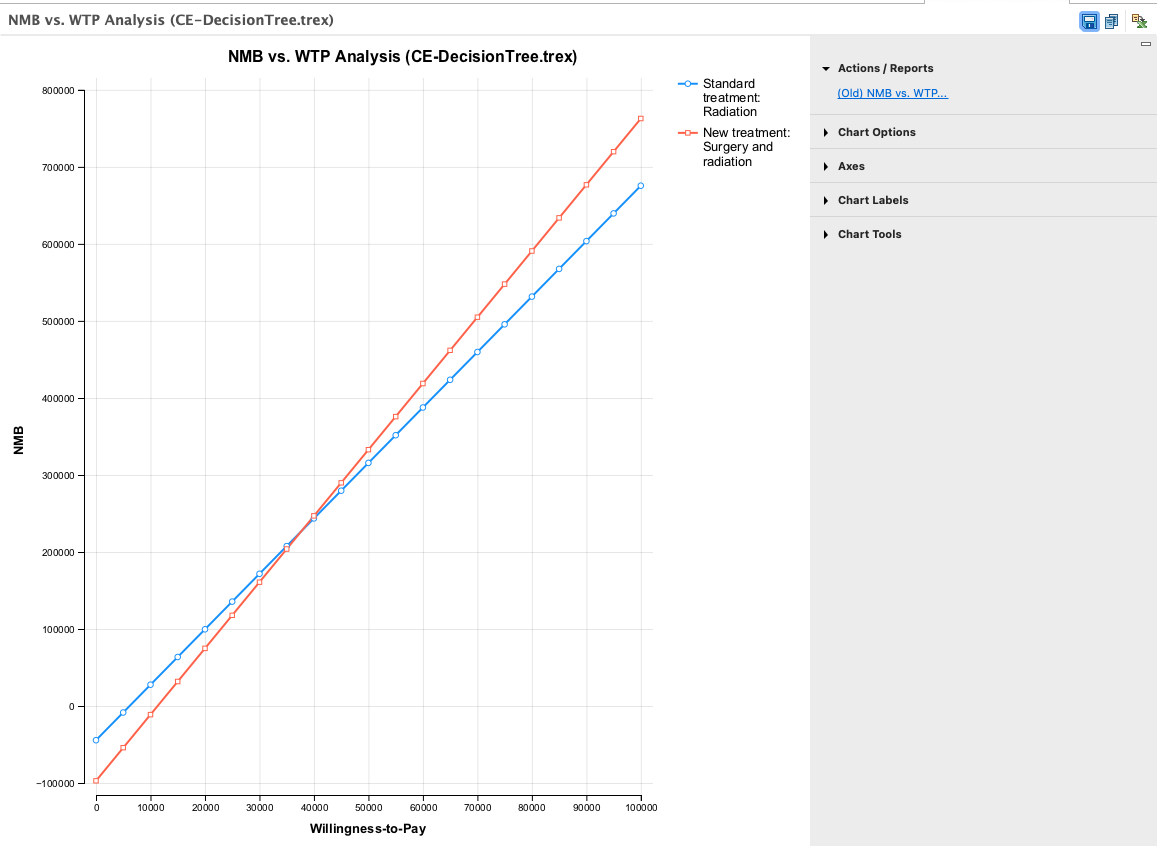
NMB versus WTP
Net monetary benefits (NMB) calculations integrate a particular WTP value and will prompt you to provide a WTP value range. The Net Benefits vs. WTP graph, in both average and incremental formats, functions as a sensitivity analysis on WTP.
An intervention’s mean effectiveness and cost statistics for the simulation are the only other inputs for each calculation of that intervention’s net benefit.
You can can generate the Net Benefits versus WTP by following these steps:
-
Open the example model CE Decision Tree.
-
Select the Decision node.
-
In the Analysis menu, select NMB vs WTP.
-
In the NMB vs WTP Parameters dialogue which opens, observe the WTP value range is set from 0 to 100,000 with 20 intervals. Select OK.
The graph below shows output generated as the NMB changes by strategy over the range of WTP. The strategy with the highest NMB at a given WTP is the optimal strategy at that WTP. The optimal strategy changes when the NMB = ICER. If there are more than two strategies, there maybe more than one such strategy change.
Additional background on the net benefits framework and analyses can be found in various journal articles, including:
-
"Quantifying stochastic uncertainty" Glick, Briggs, and Polsky, Expert Rev Pharmacoeconomic Out Res 1(1), 25-36 (2001) [and www.future-drugs.com].
-
"Net Health Benefits," Stinnett and Mullahy, Med Decis Making 18 (1998) supplement: S68–S80.
