24.3 Price threshold analysis output
The Price Threshold Output presents the results by Variable Set and by WTP Value.

The report title shows you the pair of Strategies you are selecting. In this case: Tx 1 versus Tx 2 (Tx 2 is more costly and more expensive).
For each Variable Set, you see the default price (baseline) and the ICER (baseline) at that price.
Within each Variable set, you then see each WTP Value with the maximum price value (variable price_Tx2) where the model generated an ICER equal to the WTP value.
From the example above, for Variable Set Low Risk Patients:
-
At the default price of price_Tx2 = 6000, the ICER is $74.8K/QALY, which exceeds all of the WTP values in the list. Therefore, we know that the price must be reduced for the ICER to meet the WTP thresholds.
-
For each WTP, a maximum price is calculated:
-
The maximum price that would generate an ICER of 40K is $4346.
-
The maximum price that would generate an ICER of 50K is $4821.
-
The maximum price that would generate an ICER of 60K is $5296.
-
Note that with a higher WTP, a higher price can be justified for the more expensive and more effective Tx2.
The report does not show the Calculation Count because this was not selected for the analysis.
Variable Set Diffs Report
Click on the "Variable Set Diffs" link to the right of the Price Threshold Report to review the Variables which are different between Model Scenarios.
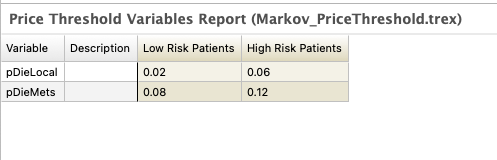
All other root node variable definitions are the same for the two Variable Sets, hence they do not appear in the "difference" report above.
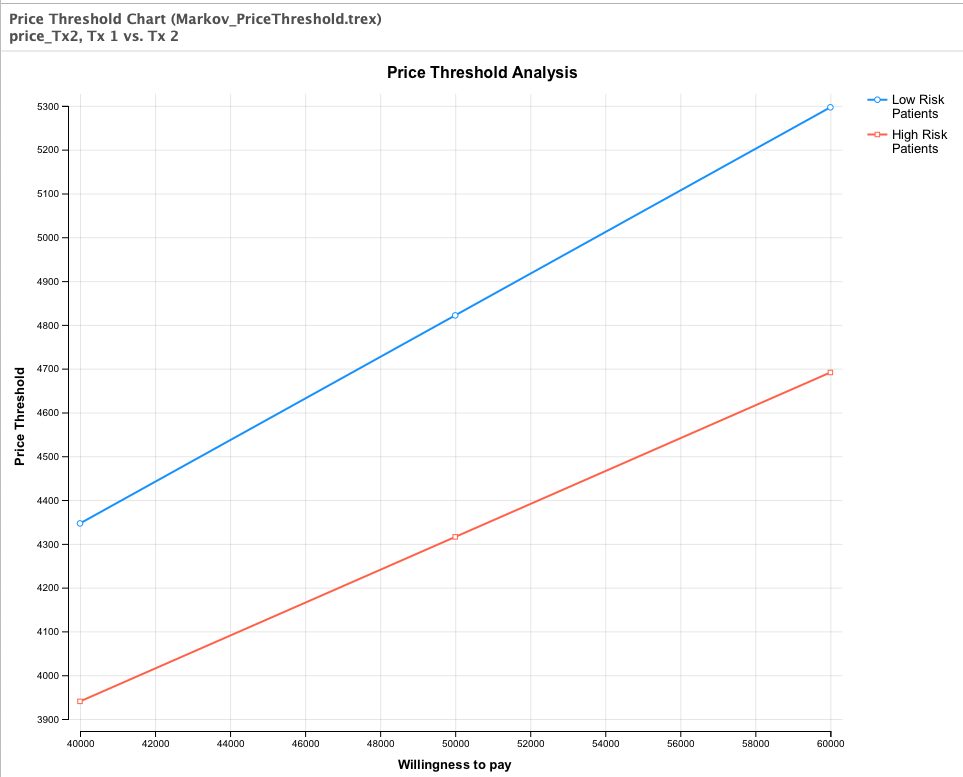
Price Threshold Graph
Click on the "Price vs WTP graph" link to the right of the Price Threshold Report to generate a graph showing how the maximum price changes relative to WTP. The report setup dialog allows you to select which Model Scenarios (variable sets) to include in the graph.
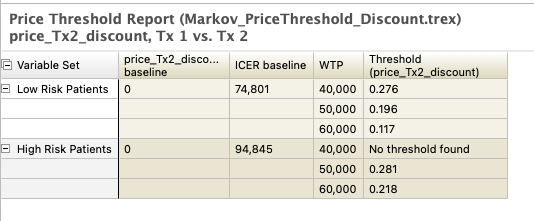
Price Threshold Analysis on Price Discount
To run the analysis on the price discount as opposed to the price, we just select the appropriate variable for discount in the Price Threshold Analysis parameters.
The model Markov_PriceThreshold_Discount.trex is set up with price_Tx2_discount as the price discount.
The outputs under the Threshold column show the discount which would need to be set such that the ICER matches the WTP. Note that no discount value within the bounded range was found for High Risk Patients and WTP 40,000.