28.4 Graph Specific Controls
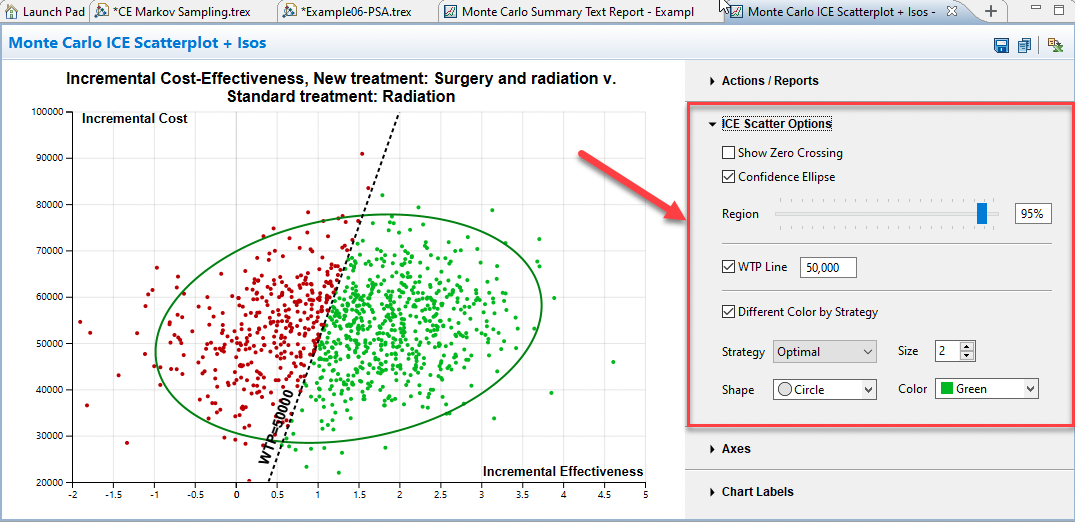
Some graphs include a set of controls specific to that graph. For example, the ICE Scatterplot graph has controls related to the confidence elipse, the WTP line and the scatterplot markers.

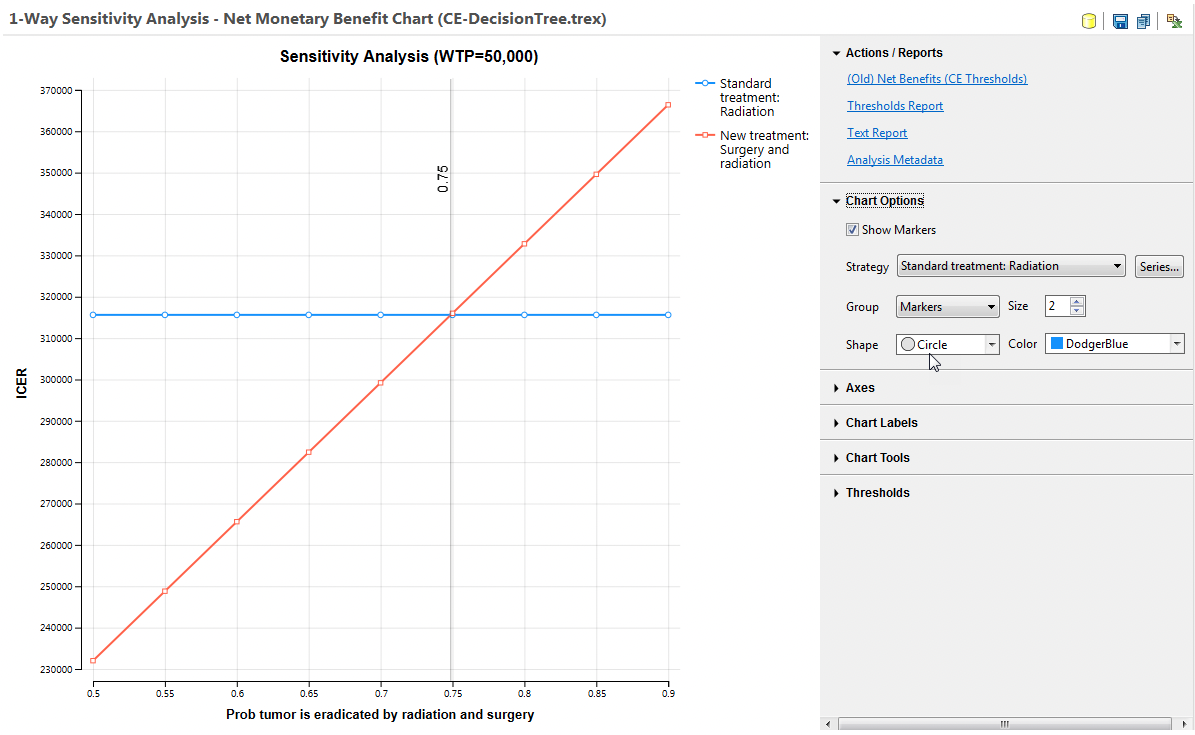
Line graphs will contain controls for the appearance of each series, including the color, size, etc. of lines and markers. These are under the section Chart Options.

Chart Options provides the ability to remove series from the graphs. Options available are:
-
Show Markers: Check the box to display or hide the markers on the lines on the graph.
-
Series... : This option will allow you to hide, show and rename the series in your graph. When this is clicked:
-
Tick boxes to remove the series from the graph.
-
Edit the name of the series in the dialogue.
-

