28.9 Combining Graphs
You can combine several TreeAge Pro graphs from TreeAge to present consolidated data. There are three graphs you can currently combine:
-
Survival Curve graph from Markov
-
Survival Curve graph from Partitioned Survival Analysis
-
StateProb graph from Markov
To illustrate how to combine graphs, we will use Healthcare Example model Markov Cancer Decision.trex.
-
Run Markov Cohort Analysis at Tx1 and then at Tx2.
-
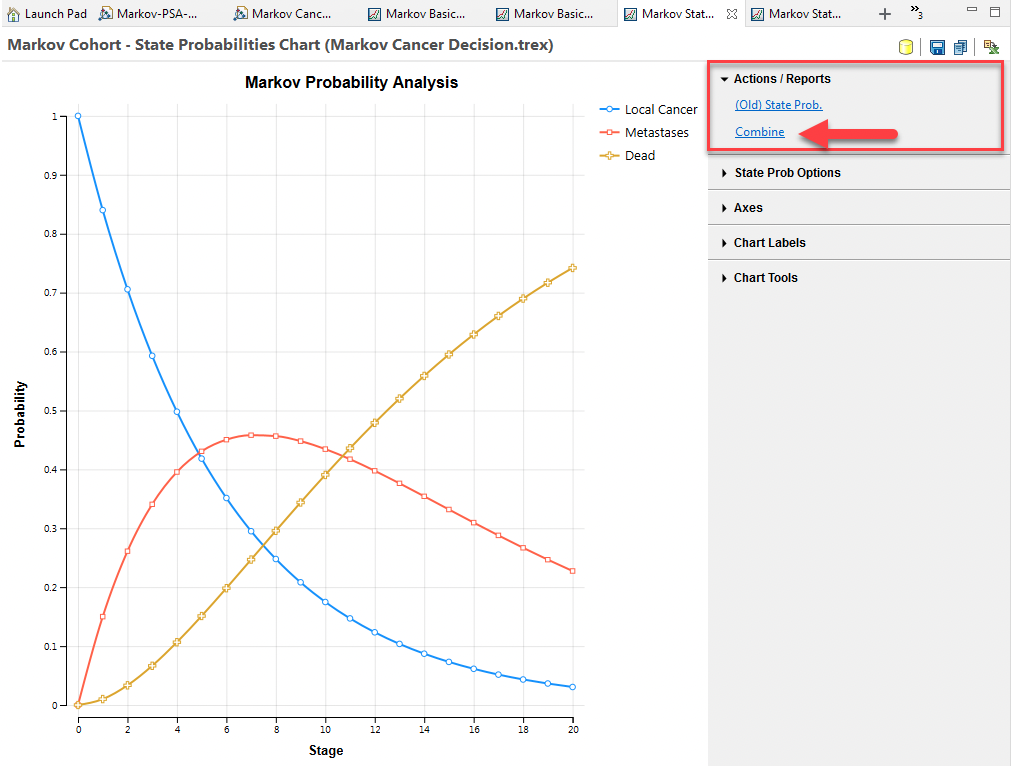
From each Markov Cohort output, generate the State Prob graph. You should have two State Prob graphs open as tabs in the software.
-
To the right of either graph, click the Combine link under Actions/Reports (see first figure below).

-
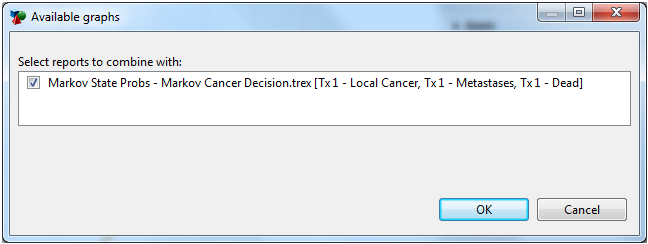
A window will pop up asking which (from the available and open graphs) you want to combine.

-
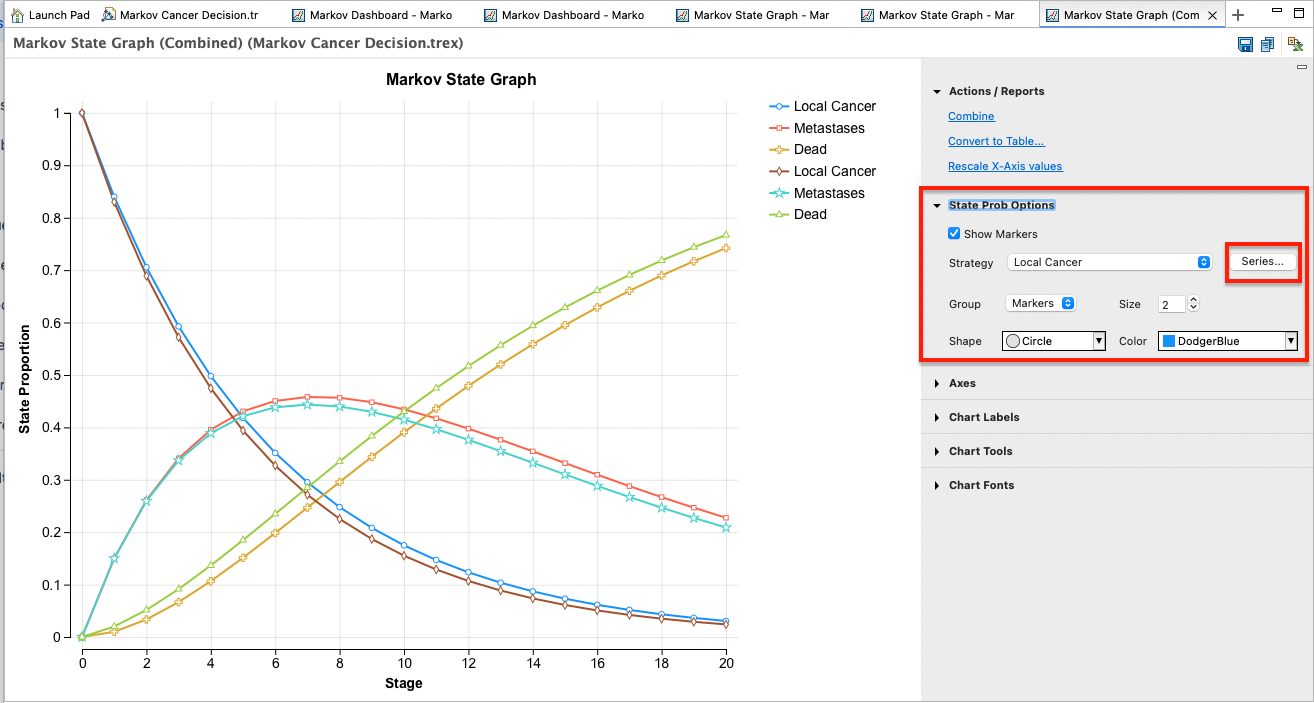
Click OK, and the new combined graph will be displayed.

-
If desired, use the options to the right of the graph to edit and remove series from the combined graph as indicated (see above).
