30.1 Debug Using the Calculation Trace Console
TreeAge Pro provides debugging options to display the internal calculations performed as a model is analyzed. These calculation details can then be reviewed in the Calculation Trace Console, providing valuable validation and debugging information.
The debugging options provide flexibility to generate debug output for the entire analysis or limit the output to specific calculations, Markov cycles, trials, etc.
To setup debugging options, open Tree Preferences and select the category Analysis Settings > Debugging/Calculation Trace Console as shown in the figure below.
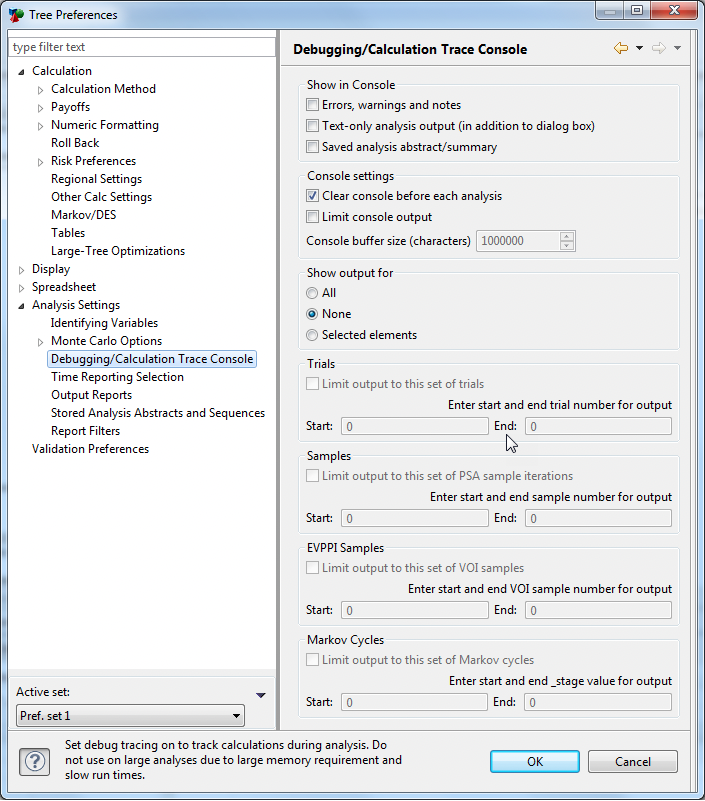
The Debugging/Calculation Trace Console options include the following...
-
Show in Console: Select the items you wish to see in the debug view as TreeAge Pro performs calculations.
-
Errors, warnings and notes: Check this box to avoid having TreeAge Pro pop-up dialogs when warnings or error messages need to be displayed; instead, checking this box will have the text added to the Calculation Trace Console.
-
Text-only analysis output: Check this box to write text report analysis output to the Console. For example, Rankings output is purely text and would be written to the Console.
-
Saved analysis abstract/summary: Check this box to display summary information in the Calculation Trace Console about any new analyses available for storage. This information can be stored for later use via Stored Analysis.
-
-
Console settings: Select how you want the output to the console to be displayed.
-
Clear console before each analysis: Check this box to clear the console before each new analysis.
-
Limit console output (if # of lines exceeds): Select the maximum number of lines to display within the Calculation Trace Console. Older lines are dropped when the maximum number of lines is exceeded. A larger number holds more outputs in the debug view, which uses more system resources.
-
-
Show output for: Controls whether calculations should be written to the console. These are is the most important debugging settings.
-
All: Calculation Trace Console will show all calculations executed during the analysis.
-
None: No trace ouptut generated.
-
Selected Elements: Calculation Trace Console will show calculations only for specific elements within the model. You then need to select the elements you want to debug in your model in model input views.
-
Variable definitions calculations - via the Variables and Variable Definitions Views
-
Tracker modification calculations - via the Tracker Modifications View
-
Distribution parameter calculations and sampling - via the Distributions View
-
-
-
Markov Cycles: Option to limit output to a specific set of cycles for a Markov model.
-
Trials: Option to limit output to a specific set of trials for a Microsimulation model.
-
Samples: Option to limit output to a specific set of PSA iterations for a Sampling/PSA analysis.
-
EVPPI: Option to limit output to a specific set of EVPPI iterations for a EVPPI Sampling/PSA analysis.
Consider the Health Care tutorial example model, Markov Conversion Model.trex. This is a Cancer Model with two treatment strategies. It is not a microsimulation model and can be run with usual Expected Value calculations. We will run the model with debug turned on for All and then for Selected Elements in the subsequent sections.
30.1.1 Show Debug Output for All
To show debug output for all calculations:
-
Open the Markov Conversion Model.trex.
-
Open the Tree Preferences > Analysis Settings > Debugging/Calculation Trace Console
-
In "Show Output for" select All. Then select OK.
-
Rollback the model and then examine the Calculation Trace Console.
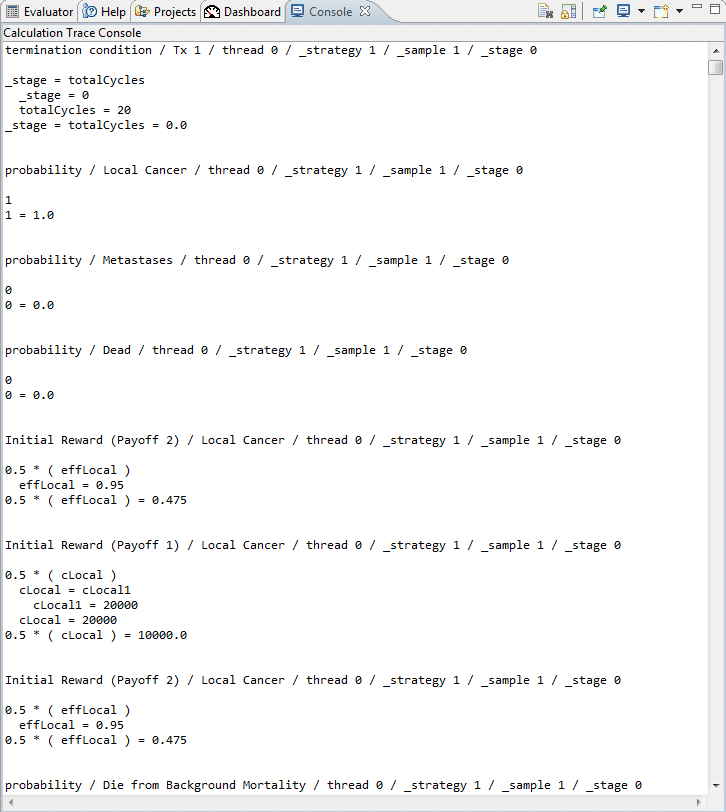
The Calculation Trace Console shows the extensive output which is every calculation the model makes during analysis. This can be examined for total transparency of the calculations in the model. The figure above shows the first calculations in the model - the termination condition check, the health state initial probabilities, and the Markov rewards for the Local Cancer state.
To Open the Calculation Trace Console: If your Calculation Trace Console is not open, select the Views menu and select the Console from the dropdown menu.
30.1.2 Show Debug Output for Selected Elements
To show debug output for selected elements/calculations within the model:
-
Open the Markov Conversion Model.trex.
-
Open the Tree Preferences > Analysis Settings > Debugging/Calculation Trace Console.
-
In "Show Output for" select "Selected Elements". Select OK.
-
There is an option to limit the output based on Trials, Samples, EVPPI samples and Markov Cycle. We will not limit the output for this example.
-
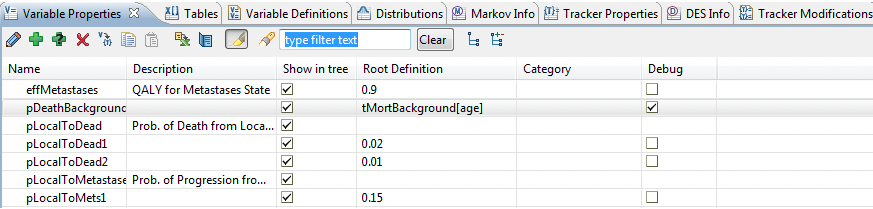
Next, select elements in the model to Debug. In this example we will review calculations of the variable pDeathBackground. Open the Variables View, locate the variable pDeathBackground, and check the Debug box (as shown in the figure below).
-
Rollback the model and then examine the Calculation Trace Console.
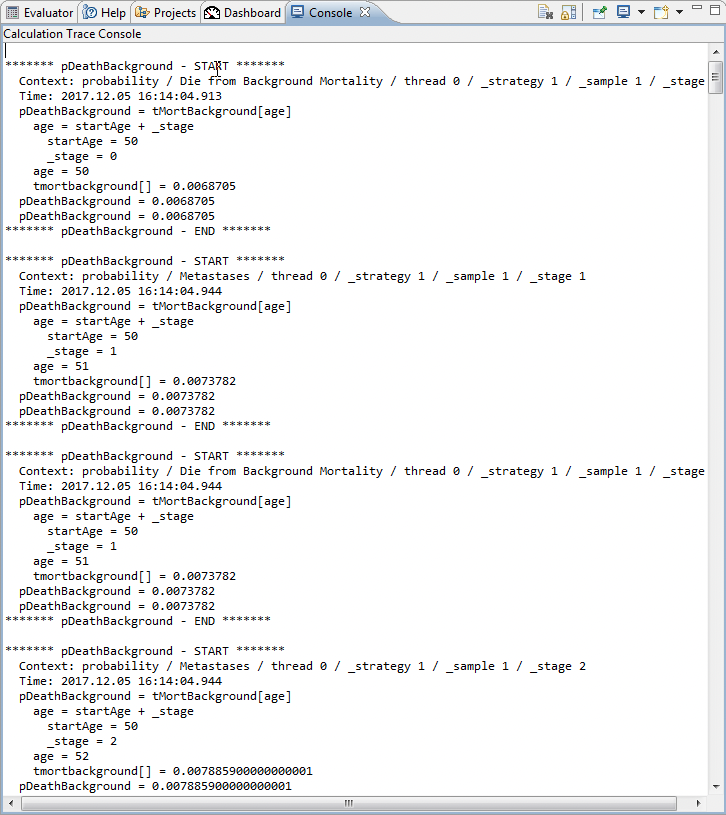
Examining the Calculation Trace Console for pDeathBackground we can examine the common elements.
-
******** pDeathBackground - START ******: Indicates the start of the calculation of the parameter selected for debugging.
-
Context: This indicates where in the tree, for which strategy, sample and cycle the calculation is occurring.
-
Time: Time of the calculation in TreeAge Pro.
-
Details about the calculations, including the calculations for any other elements in the model which need evaluating to complete the calculation.
-
******** pDeathBackground - END ******: Indicates the end of the calculation of the parameter selected for debugging.
This format is used for any model element selected for debug output.
Note that if you want to debug a variable definition that is not at the root node, use the Variable Definitions View with the appropriate node selected.
30.1.3 Show Debug Output for Payoffs
To show debug output for a payoff calculation:
-
Open the Health Care training example model, Example02-Variables.trex.
-
Open the Tree Preferences > Analysis Settings > Debugging/Calculation Trace Console.
-
In "Show Output for" select "Selected Elements". Select OK.
-
From the Views menu open the Node Properties View.
-
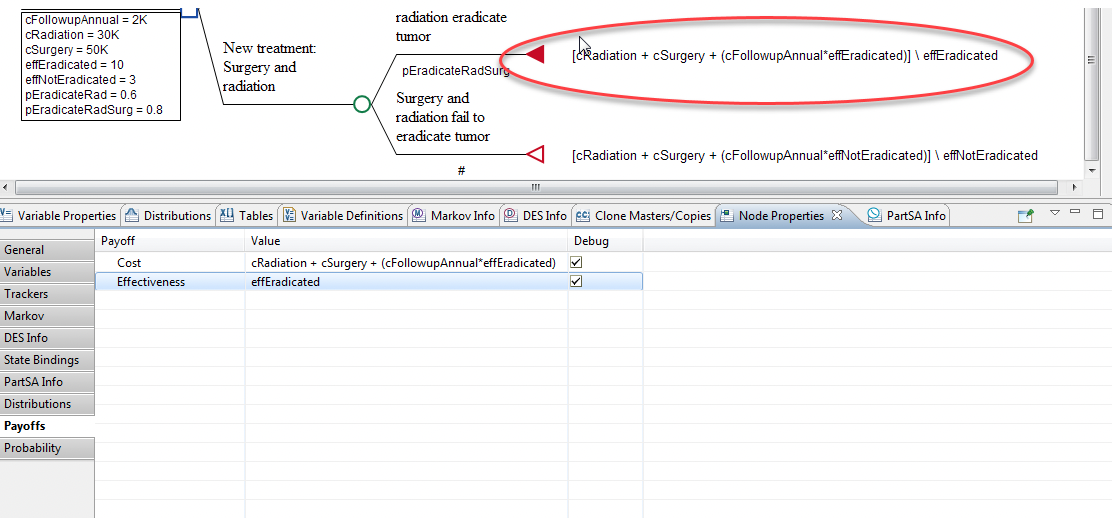
Select the node "Surgery and Radiation eradicate tumor" where there are cost and effectiveness payoffs set (as highlighted in the figure below).
-
In the Node Properties View use the tabs on the left hand side to go down to Payoffs and then check the box next to the cost and effectiveness payoffs for debugging. The figure below shows this.
-
Rollback the model and then examine the Calculation Trace Console. The output is similar to debugging as variable, as detailed above, but in the context of evaluating the payoffs.
30.1.4 Show Debug Output for Probability Expressions
To show debug output for a branch probability calculation:
-
Open the Markov Conversion Model.trex.
-
Open the Tree Preferences > Analysis Settings > Debugging/Calculation Trace Console.
-
In "Show Output for" select "Selected Elements". Select OK.
-
From the Views menu open the Node Properties View.
-
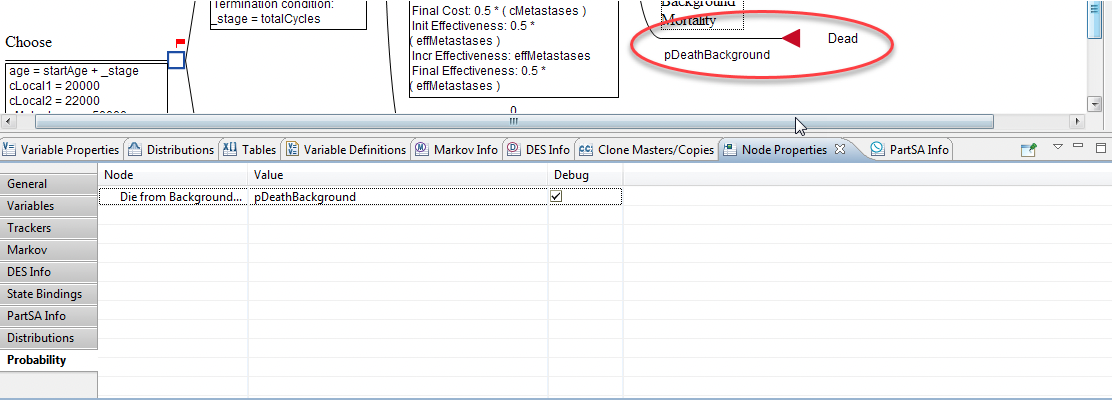
Select the node "Die from Background Mortality" where the probability is pDeathBackground.
-
In the Node Properties View use the tabs on the left hand side to go down to Probabilities and then check the box next to pDeathBackground for debugging. The figure below shows this.
-
Rollback the model and then examine the Calculation Trace Console. The output is similar to debugging as variable, as detailed above, but in the context of a Probability Expression.
30.1.5 Show Debug Output for Trials in a Microsimulation model
For Microsimulation models, you can show debug information for each patient or limit it to specific patients.
To show debug output in a Microsimulation model:
-
Open the Health Care tutorial example model, MicrosimulationCancerModel - Distributions.trex. This is a Microsimulation model including Trackers.
-
Go to Tree Preferences > Analysis Settings > Debugging/Calculation Trace Console.
-
In "Show Output for" select "Selected Elements". Click OK.
-
There is an option to limit the output based on Trials, Samples, EVPPI samples and Markov Cycle. We will not limit the output for this example but we will only run two trials in the analysis.
-
Next, select elements in the model to Debug. In this example we will review calculations of the variable pAE_Death and the tracker modification t_AE at the Adverse Event node. Open the Variables View, locate the variable pAE_Death, and check the Debug box (as shown in the figure below). Select the Adverse Event node, open the Tracker Modifications View, and check the Debug box next to the tracker modification.
-
Run Microsimulation for two trials and then examine the Calculation Trace Console.
When running a microsimulation model, if you select Show Output for All, then it is important to limit the number of trials in your analysis. There will be a large amount of data (the internal calculations) sent to the console and if there are too many, the console will crash and you are likely to get an error.
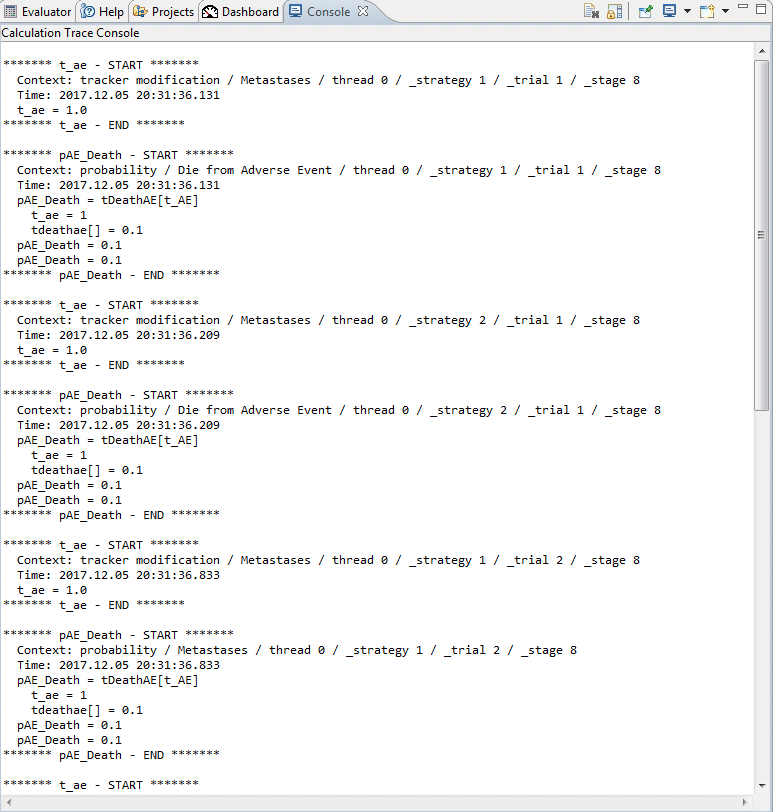
The Calculation Trace Console shows the same details per element selected as with the Cohort model, but now there are aso details about the trial included in the context. In the example above, for both trials 1 and 2, t_AE and pAE_Death are evaluated at _stage 8.
Some comments and warnings:
-
If you run a Monte Carlo Simulation analysis on a computer with multiple processors, the debug output will likely be split by thread as each thread process different iterations within the analysis.You can limit the number of threads used for analysis to consolidate this output if necessary.
-
Even if the boxes are checked in the Views, unless the Tree Preferences is set to Show Output for All, then there will be no output to see in the Console.
