31.1 Running One-Way Sensitivity Analysis on CE models
One-way sensitivity analysis involves examining the impact of uncertainty for a single model input. We will use the Healthcare tutorial example model, "CE Decision Tree.trex" for analysis.
To perform a one-way sensitivity analysis:
-
Select the decision node.
-
Choose Analysis > Sensitivity Analysis > 1 Way..., or click the toolbar button.
-
In the Sensitivity Analysis dialog, the variable pEradicateRadSurg should already be selected. You can click on the Variable column to choose a different variable from the dropdown list.
-
The range type is set to values with input entries of 0.5 - 0.9. These represent the lower and upper bounds on the uncertainty range. You can change the type to instead adjust up/down from the base case by a number or a percentage.
-
The 8 intervals count indicates how many times to calculate the model across the range. Note that 8 intervals will run 9 calculations including the upper and lower bounds.
-
Click OK to run the analysis.
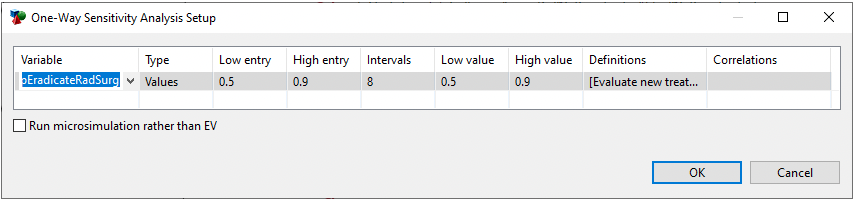
If this was a simulation model rather than a cohort model, you would check the "Run microsimulation rather than EV" box.
The following sections examine the sensitivity analysis outputs. The first output which is generated is the Dashboard.
One-Way CE Dashboard
The initial output presented is a dashboard that provides immediate visibility of the results.
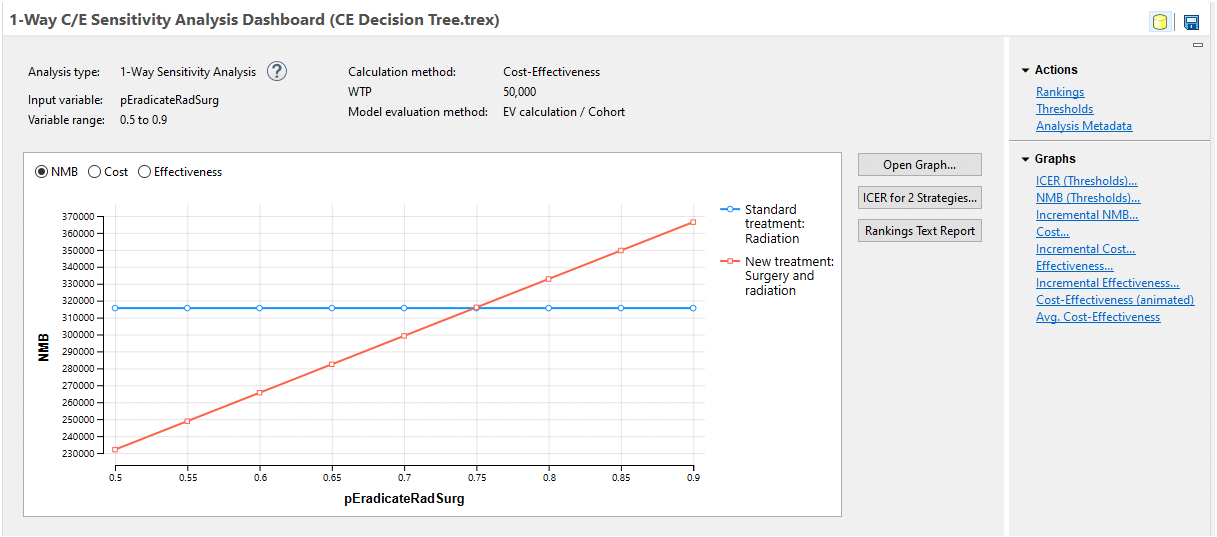
The top section describes the analysis type performed, including important elements of the model and the variable and range.
The graph shows the impact that the variable range had on results. Use the radio buttons to switch between NMB, Cost and Effectiveness.
Most of the further interpretation of the results will be done using secondary reports available either from the buttons or the links to the right of the graph. Each will be described in following sections.
