31.3 Running Tornado diagrams for CE models
Tornado diagrams study the impact several individual parameters - the parameters are analyzed separately but the results are presented together. Essentially, it is a consolidated set of one-way sensitivity analyses.
There are several types of tornado diagrams supported by TreeAge Pro. Each presents a distinct calculated value from the model on the x-axis. Each parameter variable selected in the tornado diagram has a horizontal bar representing the range of calculated values generated for the uncertainty range for that parameter.
The graph is called a tornado diagram because the bars are arranged in order, with the variable with the biggest impact (widest bar) at the top and the variable with the smallest impact at the bottom, resulting in a tornado-like appearance.
We continue using the Health Care tutorial example model, "CE Decision Tree.trex".
To run a tornado analysis:
-
Select the decision node.
-
Choose Analysis > Sensitivity Analysis > Tornado Diagram OR click the Run Tornado Diagram icon in the tool bar (in Analyze layout).
-
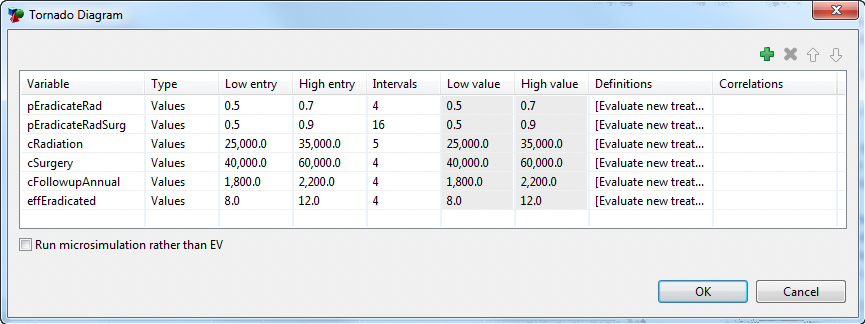
In the Tornado Diagram setup dialog, add the desired parameter variables along with their uncertainty range and intervals (just as is done for a single parameter in 1-way sensitivity analysis).
-
If model calculations requires Microsimulation (patient simulation), check the box "Run microsimulation rather than EV". This is not needed for this cohort model.
-
Click OK to start the analysis and the Tornado diagram options window will open.
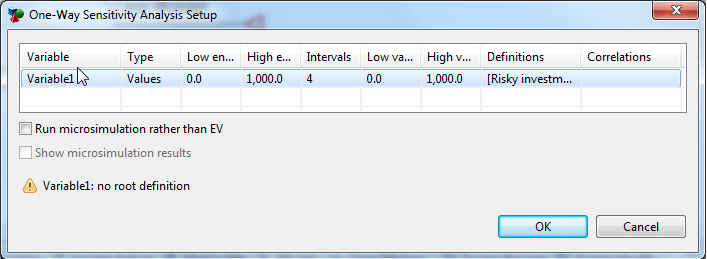
As a reminder from previous chapters, only parameters are appropriate selections for sensitivity analysis. Parameters are identified as any variable which is defined at the root node as a fixed value or parameter distribution. If you choose an invalid variable for sensitivity analysis, you will see a warning similar to the two below.
The image below shows the warning if any of the variables selected for Tornado Analysis are not a variable defined at the root node:
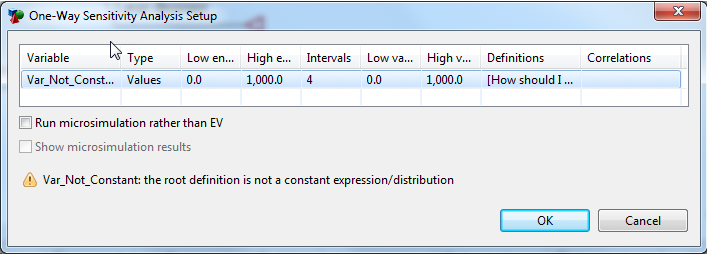
The image below shows the warning if the any of the variables selected for Tornado Analysis are not a constant or a distribution (i.e., Total_Cost, Total_Revenue):
Once the (valid) parameters are selected, click OK to run the analysis. You will then be presented with a tornado dashboard with links to the individual tornado diagrams for different outcomes.
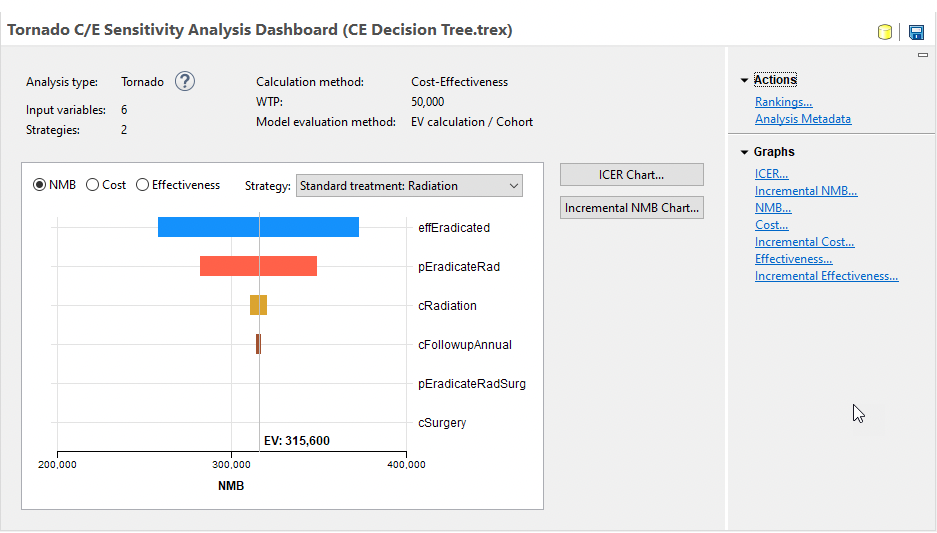
The top of the dashboard indicates that this is a Tornado analysis along with the number of input variables and model strategies. It also includes a few details about the model configuration.
The main graph provides an initial glimpse into the impact of input ranges on each strategy. Use the radio buttons to change the primary model outcome (NMB, Cost or Effectivness) and the dropdown list to choose the strategy. Note this graph does not include full details on those impacts, but those should be accessed using the secondary report links to the right of the graph. The following subsections will describe each of these secondary reports in detail.
Note that if your model contains extra payoffs beyond the primary cost and effectiveness payoffs, tornado graphs will be available at the bottom of the list. Each of those Tornado diagrams would show how an extra payoff changes with your input parameter ranges.
