31.5 2-way CE sensitivity analysis thresholds using Net Benefits
Two-way sensitivity analysis is used to examine the impact on a decision of simultaneous changes in the values of two variables. One method is to run a series of one-way analyses, each time incrementing the value of a second variable. Two-way sensitivity analysis identifies the optimal alternative for each combination of values of the two variables. Based on this, a region graph is created in the two-dimensional variable space with regions assigned to the alternatives based on their optimality. The lines dividing two regions are threshold lines.
It is possible to run 2- and 3-way sensitivity analysis on cost-effectiveness trees using Net Benefits calculations to make CE thresholds easy to identify.
TreeAge will prompt you for a willingness-to-pay value to use in the Net Benefits calculations for all strategies.
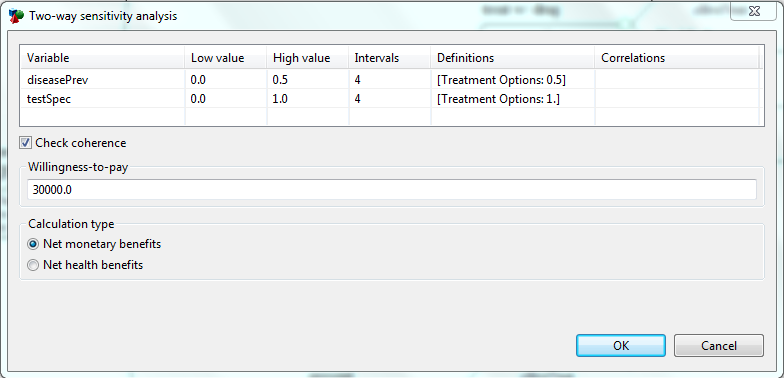
The two-way sensitivity analysis setup dialog resembles the one-way dialog, except that you must specify two variables and a range of values for each. A decision node must be selected in order to perform a two-way sensitivity analysis.
To run 2-way sensitivity analysis on an example model:
-
Open the Health Care tutorial example model "Blindness Prevention - after CE changes.trex".
-
Select the root node.
-
Choose Analysis > Sensitivity Analysis > 2 Way... from the menu.
-
Select the variables diseasePrev and testSpec and set the ranges based on the figure below.
-
Enter the Willingness-To-Pay parameter and select the calculation type based on the figure below and click OK.
For the given WTP, the strategy having the highest net benefit for any coordinate in the analysis will be assigned that point. Regions of cost-effectiveness can then be constructed on this basis. We entered very large ranges for our two variables, so all three strategy options come into play.
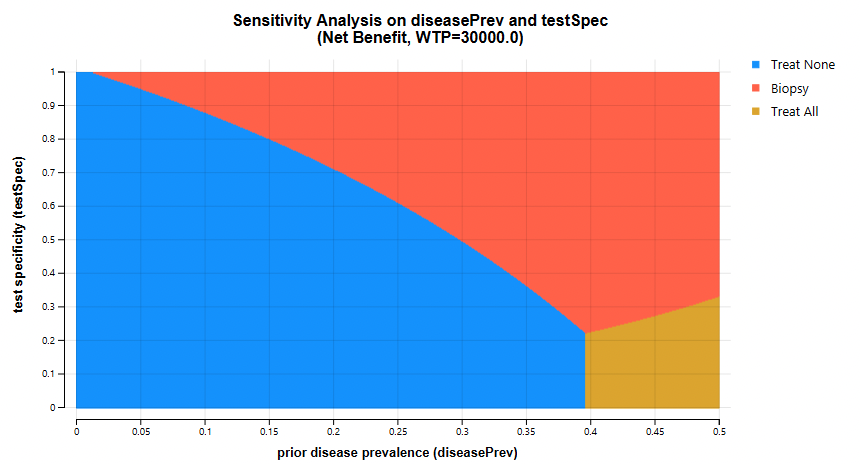
Many of the variable value combinations recommend the Biopsy strategy. However, when the test specificity is close to zero, the recommended strategy is either Treat None or Treat All. This is not surprising since a test with no specificity has no value.
Click the 3D Visualization graph link to create a graph with the x-axis and y-axis for the two variables and a z-axis for the Net Monetary Benefits of each strategy. Rather than just showing the strategy with the highest NMB as shown above, this graph shows how the NMB changes for each strategy for different input value combinations.

Click and drag on the graph to rotate it in different directions in order to best understand the relationships among the inputs and strategy NMB values.
The Text Report for the graph shows cost, effectiveness and net benefit calculations for each strategy at each combination of variables.
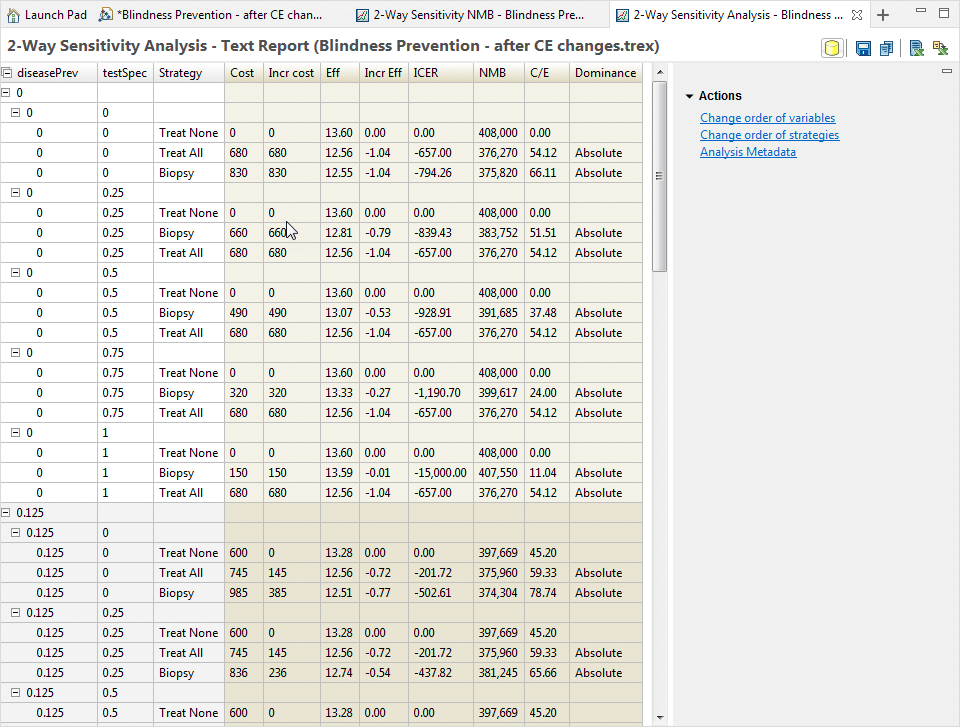
Note that at the point where diseasePrev = 0.375 and testSpec = 0.25, the net benefit values for all three strategies are very close, mirroring the border of all three strategies on the region graph.
You can change the order of variables and the order of strategies for this report via the links to the right of the report. The order selections will be included in data exported to Excel via the "Open in New Excel Spreadsheet" icon to the far right of the report toolbar.
