31.6 3-way CE sensitivity analysis thresholds using Net Benefits
3-way sensitivity analysis is run and displayed in a similar way to 2-way sensitivity analysis. Instead of selecting two variable with their ranges, you select three. The graphical output is the same except there is an animation option to show you a series of 2-way sensitivity analysis NMB graphs as the third variable changes.
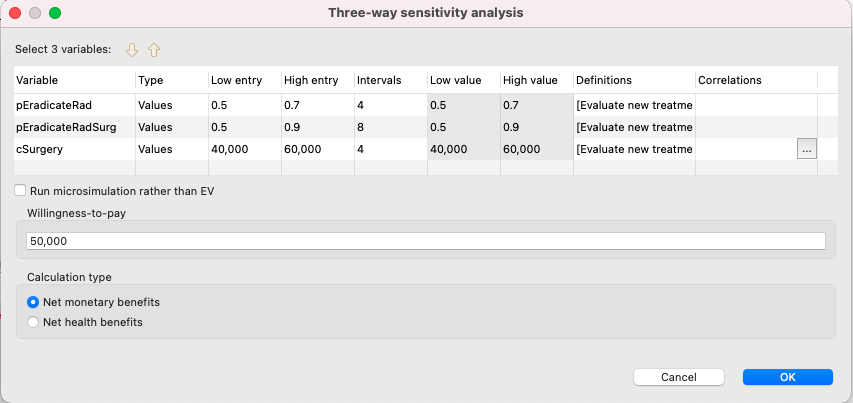
The three-way sensitivity analysis dialog looks the same as the to the two- and one-way sensitivity analysis dialog except that three variable ranges are entered.
Three variables cannot be presented clearly in a two-dimensional graph. Therefore, the results of a three-way sensitivity analysis are presented as an animated two-way sensitivity analysis region graph. The third variable is represented not with its own axis, but rather using a series of two-way graphs — if four intervals are specified for the third variable, then five graphs will be created, and shown in series.
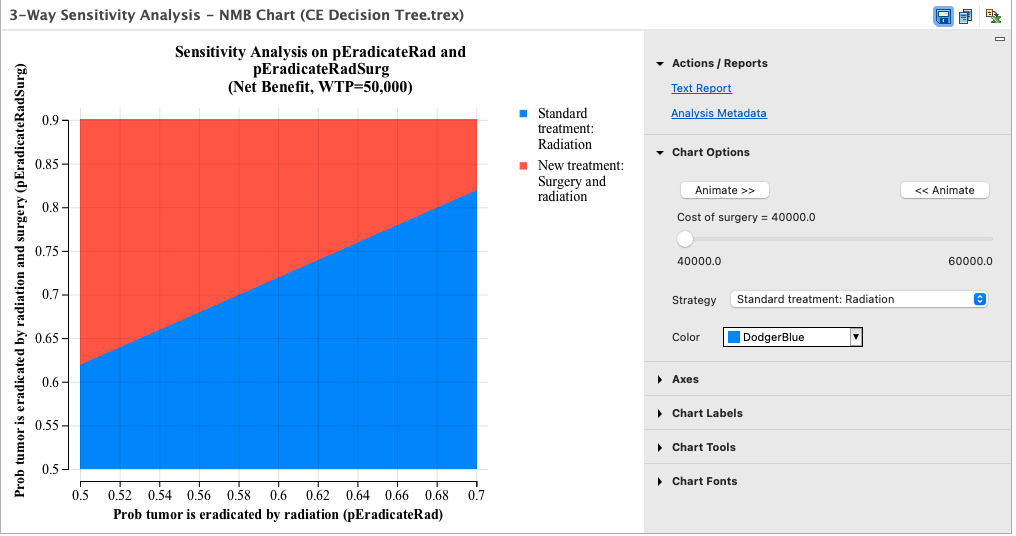
Use the Animate button or the scroll bar to cause the third variable to cycle through its range. The successive frames of the three-way analysis shows how the two-way region/optimality graph for the first two variables is affected by varying the value of the third variable.
Three-way sensitivity text report
The three-way version of the region graph now allows viewing and exporting the text report for all combinations of variables.
The three variable inputs, strategies and the corresponding output (value) are displayed in columns. The grouping is based on the first, second and then third variable.
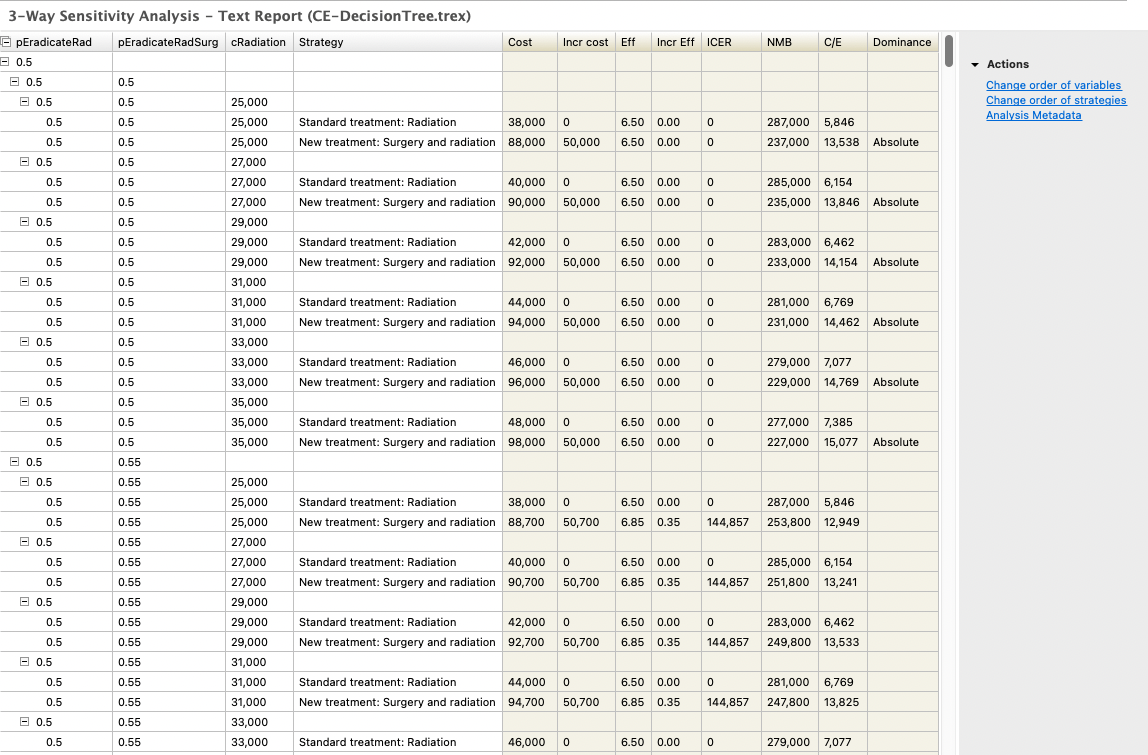
There are two text report options:
-
Change order of variables: This changes the order of the variables between columns 1, 2 and 3.
-
Change order of strategies: The changes the outputs in the value column based on the new order of the strategies.
