31.9 Threshold analysis
This specialized form of sensitivity analysis offers the ability to search more thoroughly and accurately for threshold information. The result of this analysis is a detailed, textual description of how the optimal strategy is affected by changing the value of a single variable across a designated range.
In a standard one-way sensitivity analysis, the user designates the number of intervals into which the range is to be divided; actual calculations occur only at these intervals. As a result, the accuracy of the associated threshold analysis is limited to values determined by linear interpolation.
In contrast, threshold analysis has been designed to maximize accuracy of the analysis in situations where accuracy is more critical than speed. The specified range is iteratively searched until a specified minimum tolerance is reached.
This section will use the Get Started tutorial example tree Three Variables.trex to illustrate threshold analysis.
To run threshold analysis:
-
Choose Analysis > Sensitivity Analysis > Threshold Analysis from the menu.
-
In the Threshold Analysis dialog, specify a variable and range, a tolerance and a degree of linearity. See below.
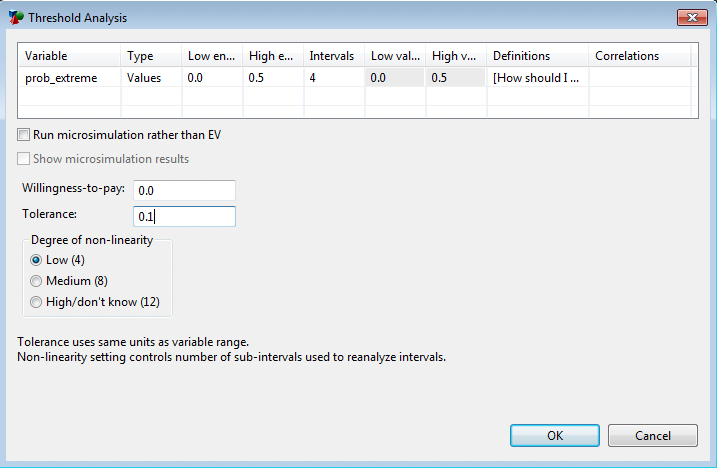
The variable selection is the same as for one-way sensitivity analysis.
The tolerance is stated in the same units of value as the variable in question; it is not a percentage. The tolerance is related to the value of the variable, not to expected value. Thus, entering a tolerance of 0.1 means that the actual location of any threshold will be within plus or minus 0.1. For example, if TreeAge Pro indicates finding a threshold at Var=0.391, this means that the threshold definitely occurs somewhere between 0.381 and 0.401. Because TreeAge Pro applies linear interpolation after it meets your tolerance, you can expect the actual reported value to be even more accurate than the tolerance.
The Degree of non-linearity is used to try to avoid missing thresholds by dividing up the range into smaller intervals for the first pass. See note at the bottom of this section for more details.
The resulting Threshold Analysis Report is presented below.
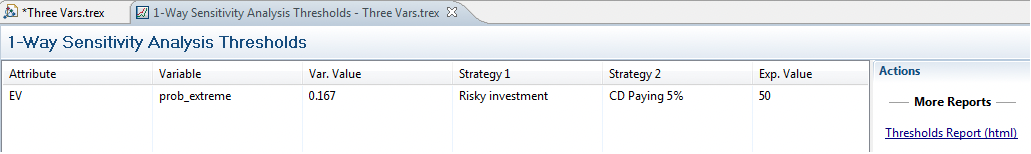
The threshold analysis report shows the thresholds (rows) and information about each threshold (columns) in a table. The columns include:
-
Attribute: The value for which thresholds were identified. This is usually EV for expected value.
-
Variable: The variable for which the value was varied to identify thresholds.
-
Var. Value: The value of that variable at the threshold.
-
Strategy 1, Strategy 2: The strategies with equal expected value at that threshold.
-
Exp. Value: The expected value of the two strategies at that threshold.
A sensitivity analysis may indicate multiple threshold values. However, this series of changes in policy will be identified correctly by TreeAge Pro only if the thresholds appear in different intervals in the first iterative pass. Since linear interpolation is used to find thresholds in a sensitivity analysis, only one threshold can be found per analysis interval.
For example, suppose that two thresholds exist in the same analysis interval, with optimality switching between the same decision options. Since the same policy is optimal at both ends, notwithstanding the intervening thresholds, TreeAge Pro will assume that no thresholds occur in that interval. There is no way to avoid this problem entirely. TreeAge Pro could subdivide a range into 100 intervals and still miss policy changes within an interval if the same optimal policy is specified at both ends. Even if different strategies are optimal at either end of an interval, and TreeAge Pro identifies a threshold in that interval, it is still possible that one or more additional thresholds in that same interval will have been missed.
For example, three alternatives, A, B, and C, might be compared using a sensitivity analysis; A is optimal at the beginning of an interval, B in the middle, and C at the end. Although you know that two thresholds (A to B, then B to C) actually occur, TreeAge Pro will find just one (a nonexistent one, A to C) from looking at the optimal alternative at the ends of the interval. The non-linearity hint is an attempt to minimize the likelihood this will occur. The more non-linear you describe the graph to be, the smaller the interval used by TreeAge Pro, so as to ensure catching any double thresholds.
