32.9 Expected Value Of Perfect Information
Expected value of perfect information (EVPI) represents the difference between the value we could achieve by making a decision based on perfect information relative to the decision we must make on imperfect information.
The reports described in this section apply to both EVPI and EVPPI.
-
EVPI is calculated when running regular probabilistic sensitivity analysis with a single parameter sampling loop.
-
EVPPI is calculated when running a double parameter sampling loop that isolates the impact of one or more parameters' uncertainty from the remaining parameter uncertainty.
We make our overall decision based on the aggregate results, but this single decision may not be optimal for every individual model calculation within the PSA. If we had perfect information prior to the decision, then we could always make the optimal choice. This analysis estimates the value of what is lost by making suboptimal decisions based on imperfect information.
-
For one set of sampled inputs, our single calculation optimal decision may match the overall optimal decision, so the EVPI is 0.
-
For another set of sampled inputs, our single calculation optimal decision may not match the overall optimal decision, so we made the wrong choice. In this case, the EVPI is difference in value between the better single calculation decision relative to the overall decision we made.
-
The overall EVPI is the average EVPI from each single model calculation.
Using the results of a PSA simulation performed at a decision node, TreeAge Pro can calculate the expected value of perfect information (EVPI) as follows.
-
Determine the overall optimal strategy from the aggregate results based on Net Monetary Benefits.
-
Loop through each model calculation to determine the EVPI for that calculation's set of sampled inputs.
-
Determine the optimal strategy for the single model calculation.
-
If the single optimal strategy does not match the overall optimal strategy, calculate the incremental net benefits (i.e single optimal less overall optimal), which will be > 0.
-
-
Report the average expected value of perfect information for all iterations.
This process estimates the value of what is lost by making suboptimal decisions for some of the simulation iterations.
To generate an EVPI/EVPPI summary report:
-
Run a CE PSA simulation at a decision node (as described earlier in this chapter).
-
Expand the PSA Outputs group to the right of the simulation summary data.
-
Click on the EVPI\EVPPI Summary Report link.
-
Enter the WTP value and the iteration range.
You will be presented with the following EVPI/EVPPI Summary report.

The summary report reflects the overall mean EVPI value aggregated from all model calculations.. Let's look at the EVPI/EVPPI Details Report (via link shown above) to see how the values are calculated for each model calculation.

This report lists every model calculation and how the NMB could possibly have led to a better decision had we known the uncertain model inputs before we had to make the decision.
In the first model calculation, that set of sampled inputs (assumed to be perfect) selected an optimal strategy of 3, which is the same as the overall decision. Since the optimal strategy selections match, the EVPI is 0.
In the third model calculation, that set of sampled inputs selected an optimal strategy of 1, which does not match the optimal decision. Therefore, we could have made a better decision given knowledge of those input values. The EVPI is the difference between that model calculation's optimal strategy NMB and the overall optimal strategy's NMB.
(NMB Single Calc Optimal - NMB Overall Optimal) = (125,198 - 109,562) = 15,636
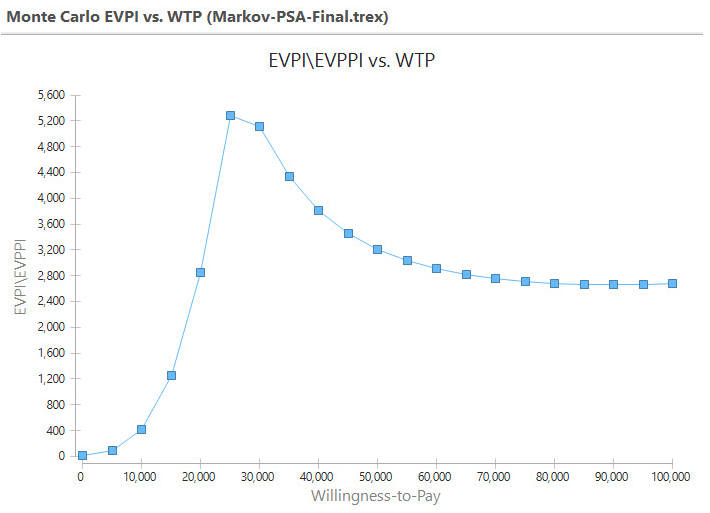
You can also generate a graph to show EVPI across a range of WTP values.
To generate an EVPI vs. WTP graph:
-
Run a CE PSA simulation at a decision node (as was done earlier in this chapter).
-
Expand the PSA Outputs groupd to the right of the simulation summary data.
-
Click on the EVPI v. WTP link.
-
Enter a range of WTP, number of intervals and interation range in the dialog, as in the figure below.
-
You will be presented with an EVPI vs WTP graph as in the figure below.


The EVPI vs WTP graph shows the overall mean values generated by the EVPI value calculated for each iteration in the simulation, for the given WTP. Note that the EVPI is highest when WTP is closest to the underlying ICER.
The Text Report generated from the link on the right of the graph provides the specific EVPPI, Cost and Effectivness values for each value of the WTP as shown on the graph.
