32.10 EVPPI Simulation on CE Models
Expected Value of Partial Perfect Information (EVPPI) simulation is a special form of PSA where one or more distributions are isolated from the remaining distributions.
This is achieved by splitting the PSA into two separate calculation loops.
-
Sample the isolated distribution(s) for the first outer loop calculation.
-
Run a full PSA analysis sampling the other parameter distributions.
-
Aggregate the PSA results into mean values.
-
Repeat 1-3 for many samples of the isolated distributions.
-
Report back the full results reflecting the uncertainty of the isolated distributions.
This analysis isolates the impact of the selected distribution(s) from the additional uncertainty of the other distributions.
We will use the same Healthcare Tutorial example model Markov-PSA-Final.trex to demonstrate this technique.
To run EVPPI analysis:
-
Open Markov-PSA-Final.trex.
-
Select the root nod.
-
Choose Analysis > Monte Carlo Simulation > EVPPI Sampling from the menu.
-
Click the Distributions button to choose the distribution(s) to isolate (see below).
-
Click OK.
Let's now examine more details on configuring the EVPPI simulation.
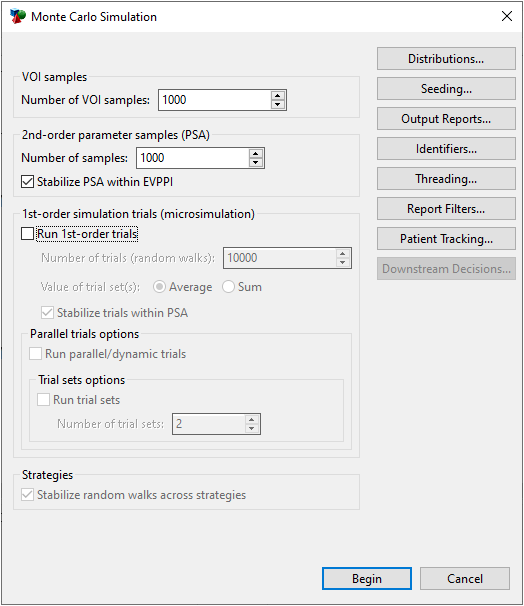
For the most part, it looks the same as the PSA startup dialog. However, there is an extra simulation loop for VOI samples placed above the standard PSA loop. This splits the PSA into two parts, one for the isolated distribution(s) and one for the remaining distributions. Additionally, there are options for patient simulation that are not needed for this example model.
Now, we must choose the distribution(s) to isolate by clicking the Distributions button. You are then presented with a note about how to choose the isolated distribution(s).
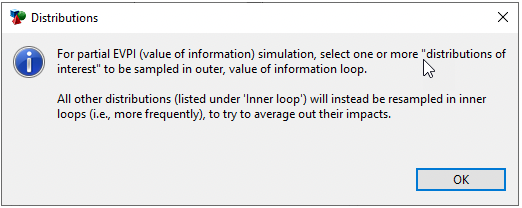
Click OK then proceed to the Distribution Sampling portion of Tree Preferences. Since this model has no patient-level distributions, we can collapse the middle sampling selection group. We also need to expand the EVPPI sampling selection group at the bottom. Then we can use the buttons to move the appropriate distribution to the right to select it for isolation in the EVPPI simulation. In the figure below, the dist_cLocal1 distribution has been isolated.
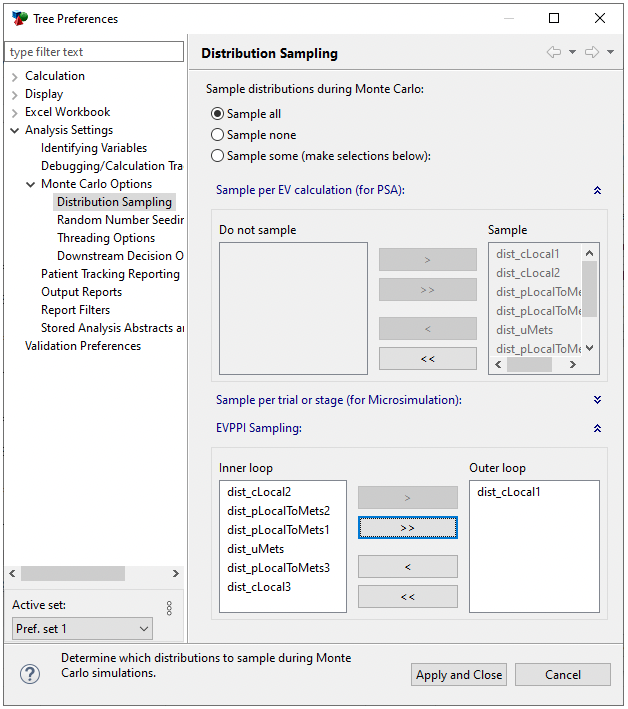
Then click Apply and Close then click Begin to run the simulation. Note that this will take a long time because it is calculating the model 1M times (1K batches of 1K analyses).
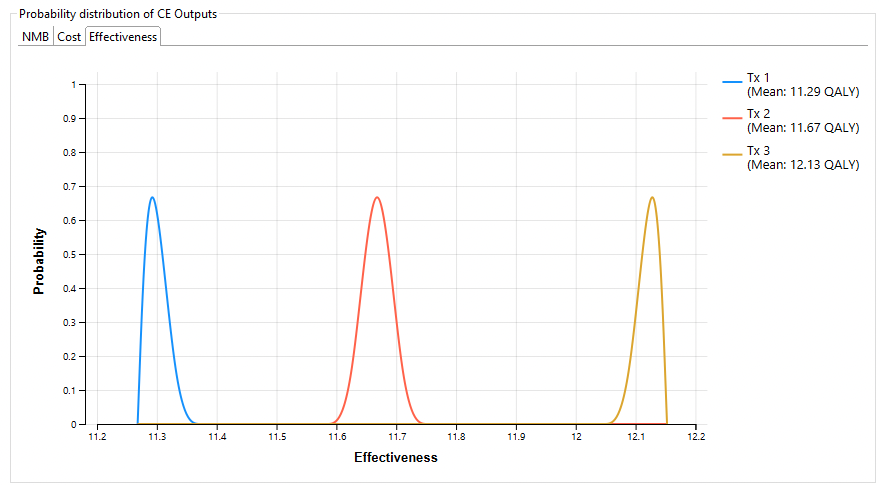
The resulting output is essentially a PSA analysis where the only uncertainty being examined is that related to the isolated distribution dist_cLocal1. You can see this in the output trend line graphs. Note the variance in cost, but only for Tx 1.
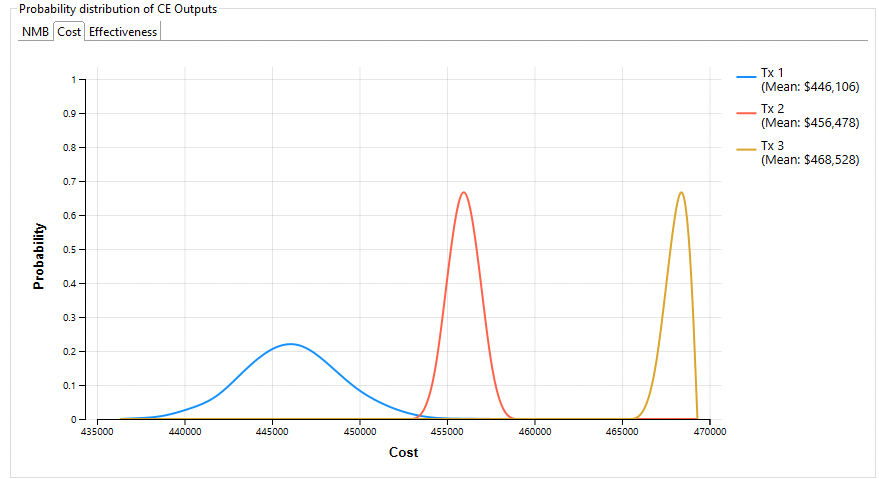
In the graph below you can see there is no variance in effectiveness for any strategy.
You can then run any of the PSA secondary reports on the EVPPI simulation results.
