34.3 Consolidated Markov Output Per Strategy
When a strategy breaks down into multiple Markov models, you can generate a single consolidated output for the full strategy. This combines the results from the individual Markov cohort analyses into a single report to provide cycle-by-cycle information for the strategy.
We will use the Health care tutorial example model Markov Split Strategy - 2 Markovs.trex.
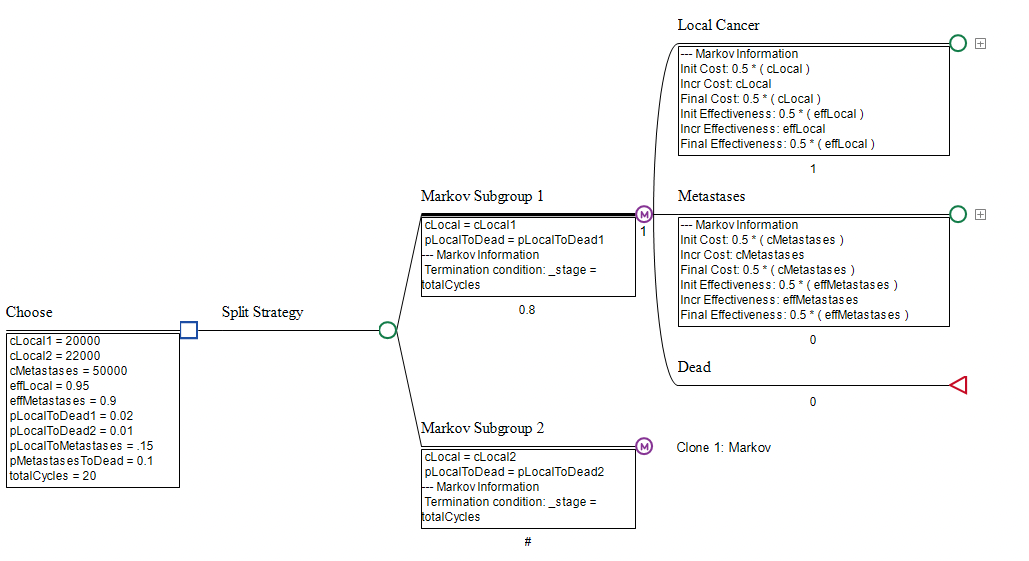
Individual cohort outputs can be generated for each of the Markov models using the usual Markov Cohort Reports. The figures below show the Basic Cohort Reports for each Markov Subgroup (Subgroup 1 at the top and Subgroup 2 at the bottom).
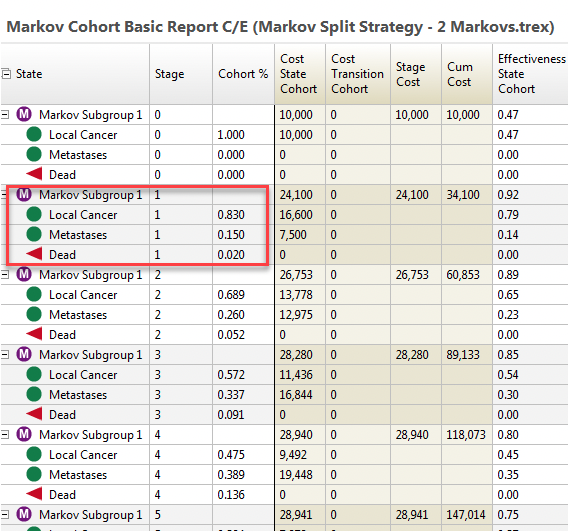
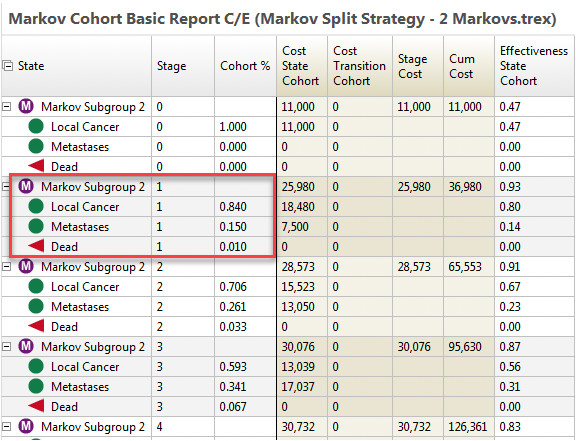
A Combined Markov Report can be generated for the whole strategy by weighting the figures for each individual cohort analysis based on the likelihood of reaching that Markov process.
To create a Combined Markov Report
-
Select the Strategy node "Split Strategy".
-
Choose Analysis > Markov Cohort from the menu.
-
NOTE: The Extended Markov Cohort report is not supported for the Combined report because there could be significant differences in the event pathways.
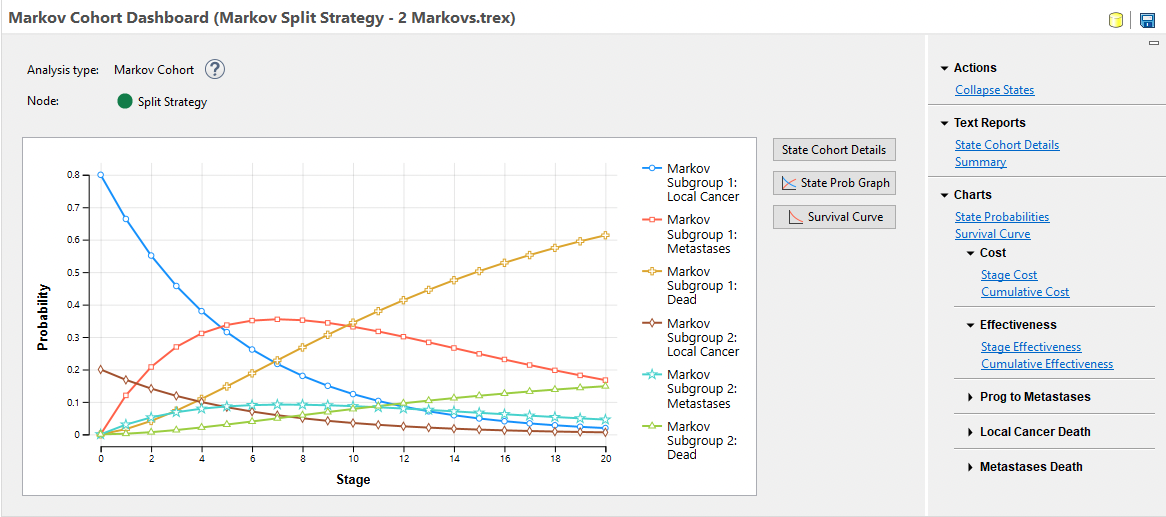
Note that the cohort flow graph shows StateProb info from each of the two Markov models within the strategy with each weighted based on the probabilities of going to each Markov node.
Also note that you cannot generate the Markov Cohort Extended Report for a split strategy.
Click Text Reports > State Cohort Details to open the Markov Cohort Basic Report, which provides more visibility into the combined Markov output.
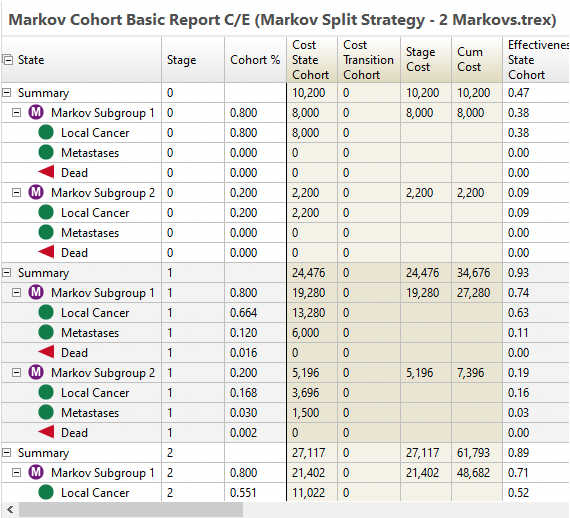
The report contains two groupings, one for each Markov model/node - Markov Subgroup 1 and Markov Subgroup 2. Within the overall strategy, each subgroup/Markov process is weighted based on the likelihood of a patient reaching the Markov node. In the model, Markov Subgroup 1 is weighted 80% and Markov Subgroup 2 is weighted 20%. We can see this in the calculations below.
| Cycle | Local Cancer | Markov Subgroup 1: 80% | Markov Subgroup 2: 20% |
| Stage 1 | Cohort % | 0.83 x 0.8 = 0.664 | 0.84 x 0.2 = 0.168 |
| Stage 1 | Cost | 16,600 x 0.8 = 13.280 | 18,480 x 0.2 3,696 |
| Stage 2 | Cohort % | 0.698 x 0.8 = 0.551 | 0.706 x 0.2 = 0.141 |
| Stage 2 | Cost | 13,778 x 0.8 = 11,022 | 15,523 x 0.2 = 3,105 |
Note that the values from the original Markov Cohort analyses for subgroups 1 and 2 have been weighted by 80% and 20% respectively, resulting in values that reflect their impact on the overall strategy. Only cohort % and cost are included in the table above, but this also applies to all other payoffs within the model.
Once you have generated the Combined Markov Report, you can then choose to combine states into a more concise presentation. For example, you might want to just show the combined values for the three states - Local, Metastases and Dead rather than showing them for each subgroup.
TreeAge will automatically group states with the same name together. In this example model, the health states are all the same but TreeAge will provide a prompt to select which health states can be combined.
To collapse states within a Combined Strategy Level Markov Report:
-
Click the link "Collapse States" to the right of the Combined Markov Report.
-
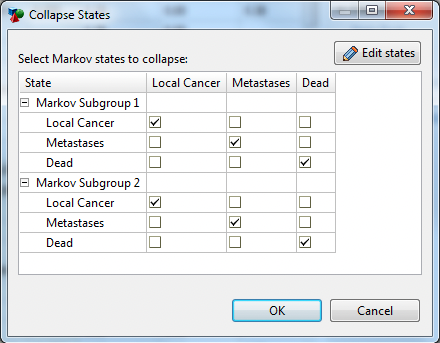
Group the health states together as you wish. For each of the individual group/state rows, choose a column to designate how to group the presentation of states in the collapsed reports.
-
Note that Treeage Pro will automatically group states with the same name together.
-
-
Click the Edit States button to modify the list of collapsed states - the columns in the dialog.
The resulting collapsed/combined Markov Cohort report includes a new grouping reflecting the inclusion of both Markov processes. The Local Cancer, Metastases and Dead states now reflect the full strategy without the split by subgroup.
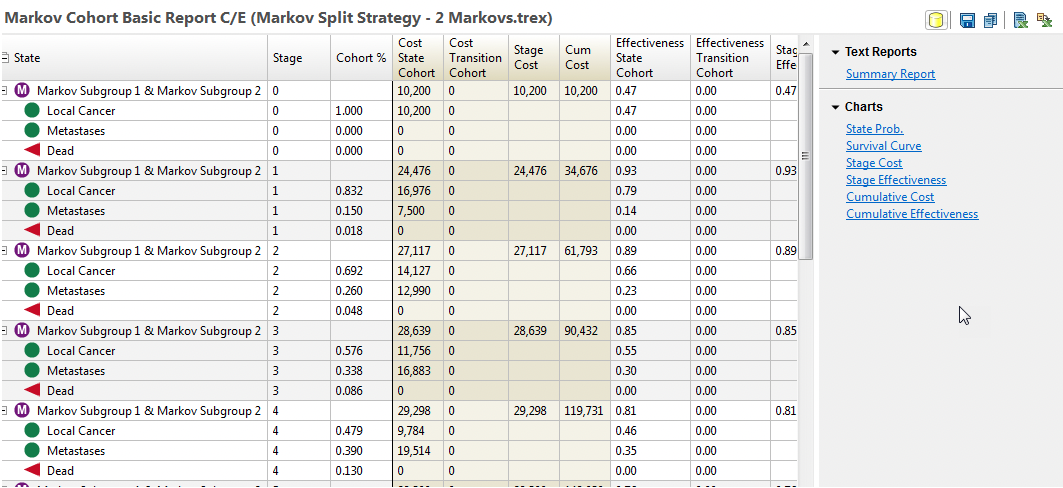
For example, at the start of _stage 2, the 0.832 proportion of the cohort in the Local Cancer state is the sum of the weighted cohort % from the two subgroups.
(0.8 * 0.830) + (0.2 * 0.84) = 0.664 + 0.168 = 0.832
We can then generate the same secondary reports for the Combined Cohort Report before or after collapsing states.
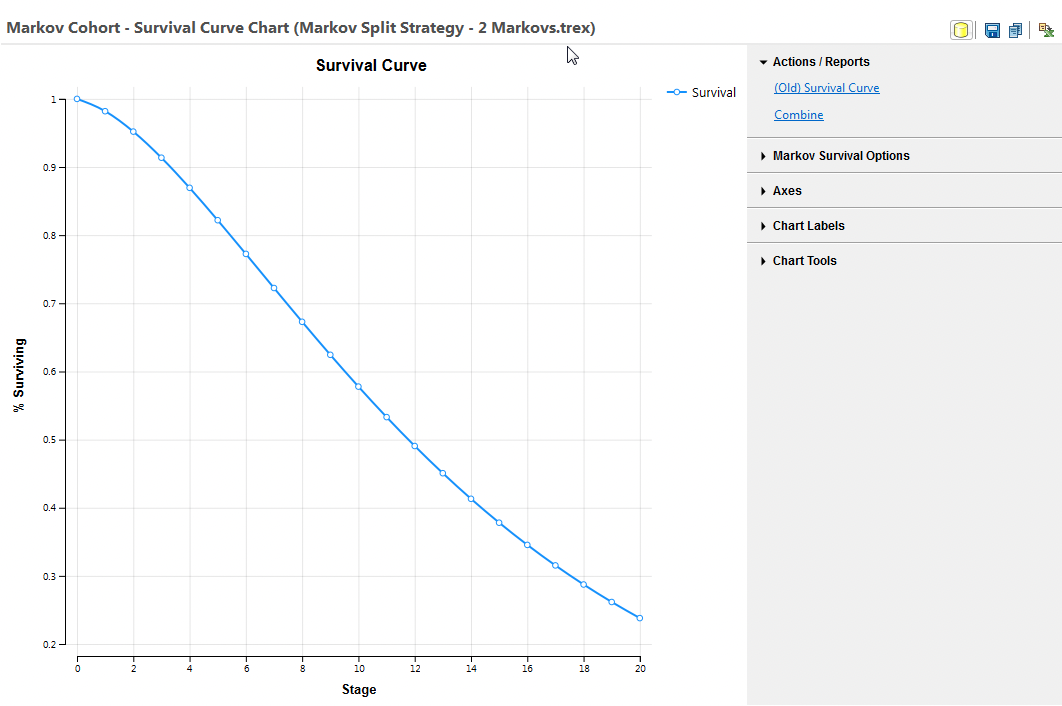
The Survival Curves from the Combined report prior to collapsing states, shows the Survival Curve for each Subgroup separately.
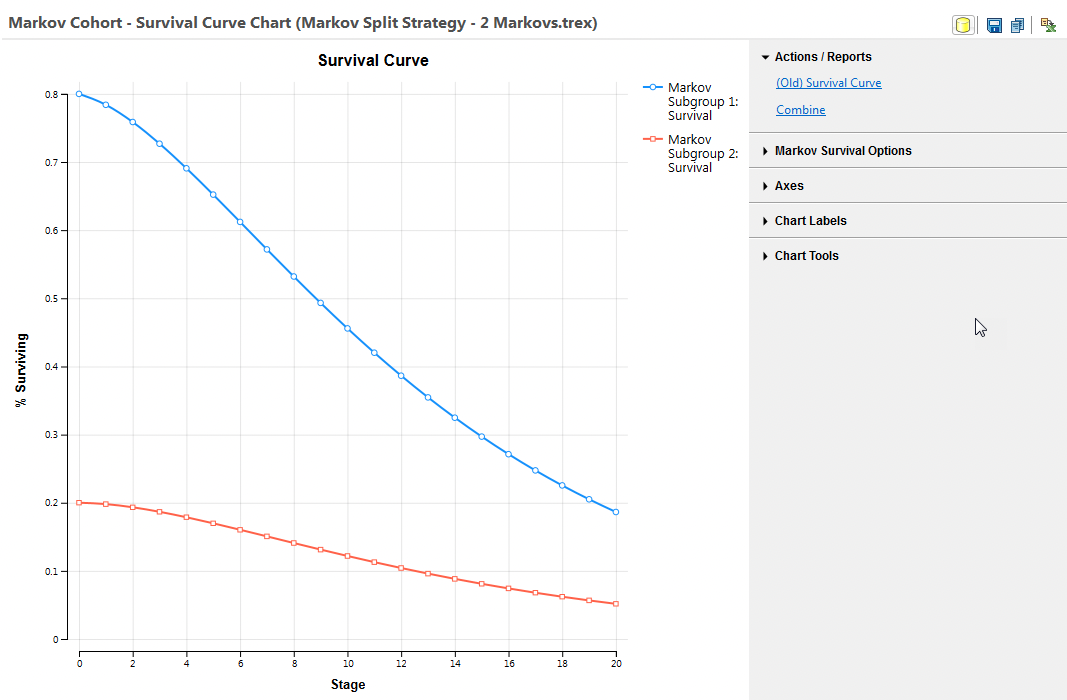
The Survival Curves from the Combined report after collapsing states, shows the Survival Curve for the entire strategy reflecting both Subgroups.
Below, we see a different approach to collapsing states, by showing the two Dead States separately but combining the two alive states. The figure below shows creating two new state names - Dead 1 and Dead 2 - capturing dead from different subgroups.
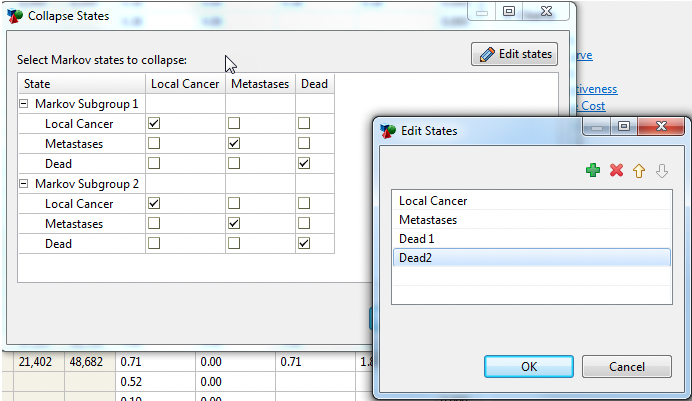
The two new states and how the states are assigned to them from each subgroup is them shown below.
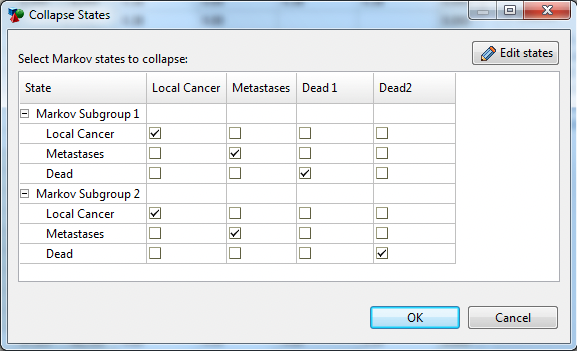
The output report will then show these new health states, with associated reports.
Note: The functionality will only work for Strategies where every endpoint is part of a Markov process (no direct Terminal nodes like). If this condition is not met you will receive an error message.
