44.1 Calculating Hazards from Survival Data
Hazard functions provide flexibility to define disease progression in you model; however, you are more likely to have survival source data. This section shows how to convert that survival data to hazards.
To illustrate the process, we will use mortality survival data from the CDC in 2022. However, this technique could be used for survival data representing any process. The CDC data can be found in Healthcare Example Models > CDC Survival Data 2022.xlsx Excel document.
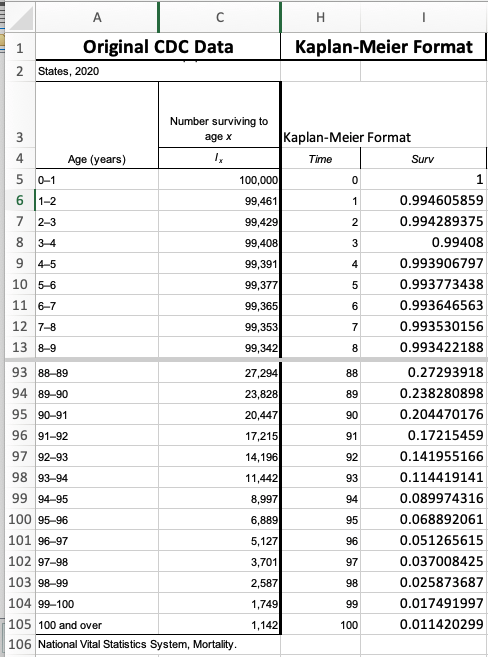
The original data was modified slightly to measure survival in fractions rather than counts in rows H-I. The data shows decline in survival over time from 1 (everyone) at time 0 to 0.1142 after 100 years.
Import the survival data into TreeAge Pro:
-
Copy the data from Excel range H4..I105 into the clipboard. Note this includes the column headings.
-
In TreeAge Pro, choose File > New Decision Tree from the menu.
-
Open the Tables View.
-
Click the + toolbar icon to create a new table.
-
Name the table KM_CDC.
-
Click the Paste icon above the empty table data to the right of the Tables View. The table will then be populated with the CDC data.
-
Click the "Convert Survival to Hazard Table" button in the Tables View toolbar.
-
The following converter dialog will appear.
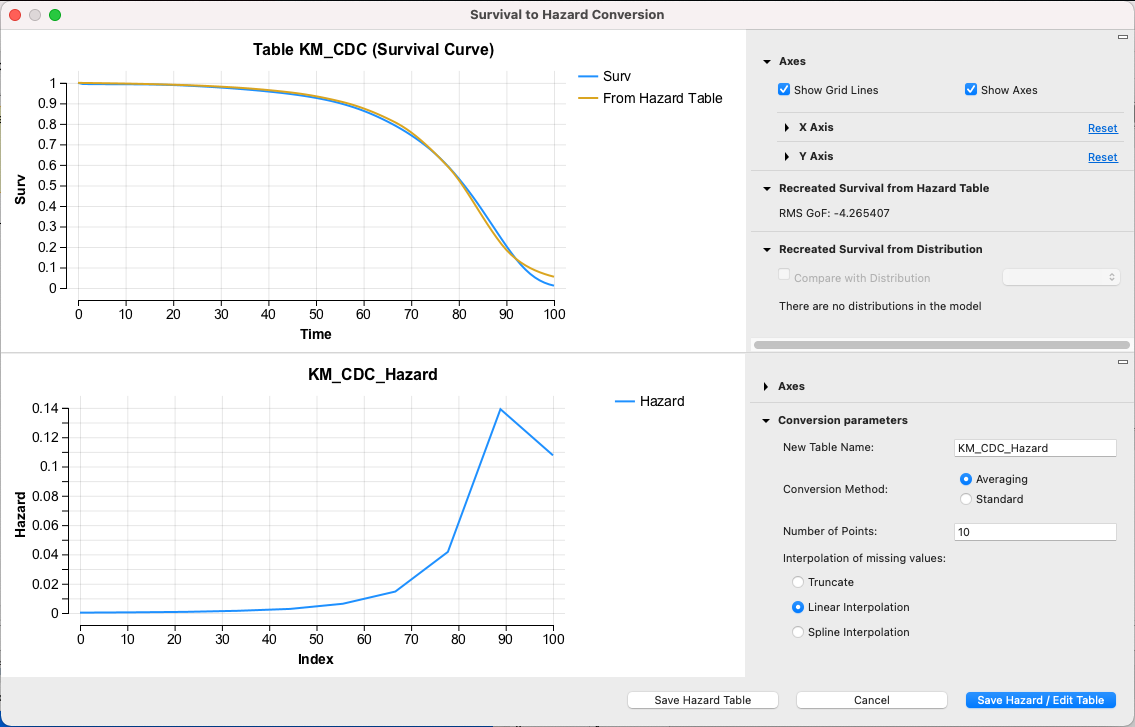
The top pane shows the original survival data, while the bottom pane shows the calculated survival data. The Hazard data is generated by calculating the risk at any point that would cause the corresponding drop in survival. See the formula below.

-
h(t) represents the instantaneous hazard over time.
-
S(t) represents the survival over time.
In modeling projects, you are more likely to have a limited survival dataset with more abrupt changes to survival. Let's repeat the conversion process on the survival table in the example model Hazards-HazardEditor.trex.
To convert the survival data:
-
Open the model Hazards-HazardEditor.trex.
-
Select the table KM_Table.
-
Click the Survival to Hazard icon in the Tables view toolbar.
Note that the conversion uses the survival data (blue) at the top to generate the hazard data at the bottom. The hazard data is then used to recalculate survival data generating the smooth (gold) survival data presented at the top. The conversion with default parameters does a fairly good job matching to the original survival data. While you can change conversion parameters to match even closer, be careful about overfitting with too many hazard calculations.
There are a few Conversion Parameter options that allow you to customize the conversion.
-
New table name: Enter the name of the new hazard table generated by the conversion.
-
Conversion Method: Averaging (default) calculates the risk over each interval then applies that risk at the beginning of each interval. Standard calculates the risk at the beginning of each interval.
-
Number of Points: For Averaging, set the number of points at which the hazard should be applied. The time horizon divided by the number of points defines the number of intervals, more points leads to smaller intervals and more hazard calculations. Note there is a balance here - more points will fit the data closer, but will typically generate more instability in the hazard table.
-
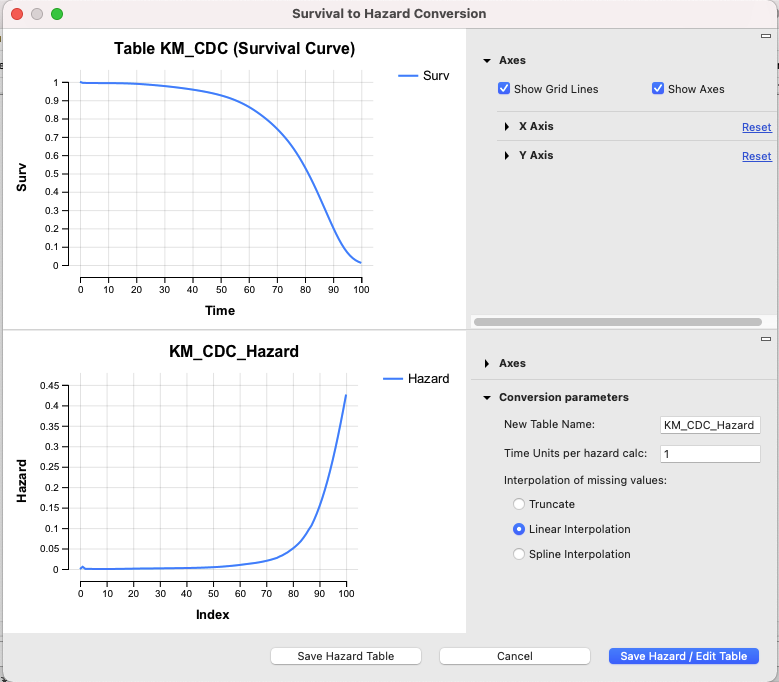
Time units per hazard calc: For Standard, set the length of the intervals for calculating hazards. Shorter intervals leads to smaller intervals and more hazard calculations.
-
Interpolation of missing values: This determines how the hazard table will be interpolated at times in between hazard table values. Linear interpolation will gradually shift hazard between points (default and is most commonly used). Truncate will use a set hazard across the interval until the next value is found. Spline interpolation will apply the spline shape to the table when interpolating between points.
Click Save Hazard Table to save the hazard data in a new table.
Click Save Hazard/Edit Table to save the hazard data and open it in the Hazard Table Editor described in the next section.
You can then use the Hazard Table from this or other sources to model disease progression as described in later sections of this chapter.
Note that the model contains multiple converted hazard tables.
-
KM_Table_Hazard1_averaging - generated using the averaging conversion method and default values.
-
KM_Table_Hazard2_standard - generated using the standard conversion method and default values.
-
KM_Table_Hazard3_edited - generated using the averaging conversion method and default values, but then edited with the Hazard Table Editor described in the next section.
Note that small adjustments to survival data may be applied during the conversion to handle scenarios where survival drops to 0. This will have no impact on your model, but allows the calculation of hazards to finish successfully.
