45.1 Survival Plot Overview
We will use the Healthcare Example Model SurvivalPlot.trex to demonstrate the capabilities of the Survival Plot View. The image below shows the model, it's Survival Curve graph and the Survival Plot View.
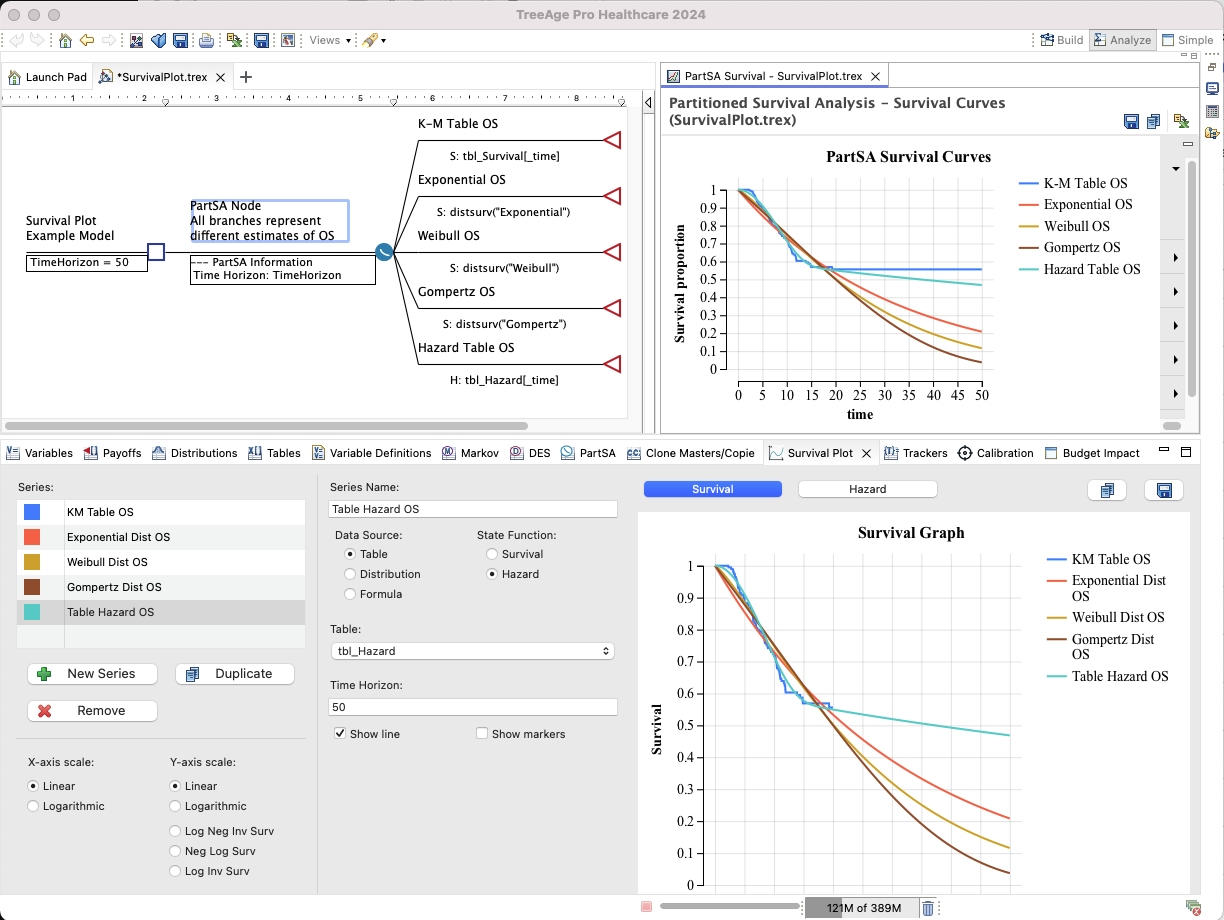
This model includes a Partitioned Survival node with branches for 5 survival curves - all represent estimates of the same overall survival. The Survival Curve graph to the right shows a graphical representation of these estimates of survival.
The Survival Plot View at the bottom includes a series for each OS estimate. However, this view does not require any model structure. You just add the series you want to see in the plotter, and the graphical representation is generated automatically. The series selections are saved with the model, so they are available if you reopen the model later. Note that only one series set is currently supported.
Since the underlying survival estimates use the same sources, the PartSA Survival Curve graph and the Survival Plot View show the same output, giving you the opportunity to determine which is the most accurate and appropriate for your model.
