45.2 Survival Plot - Components & Controls
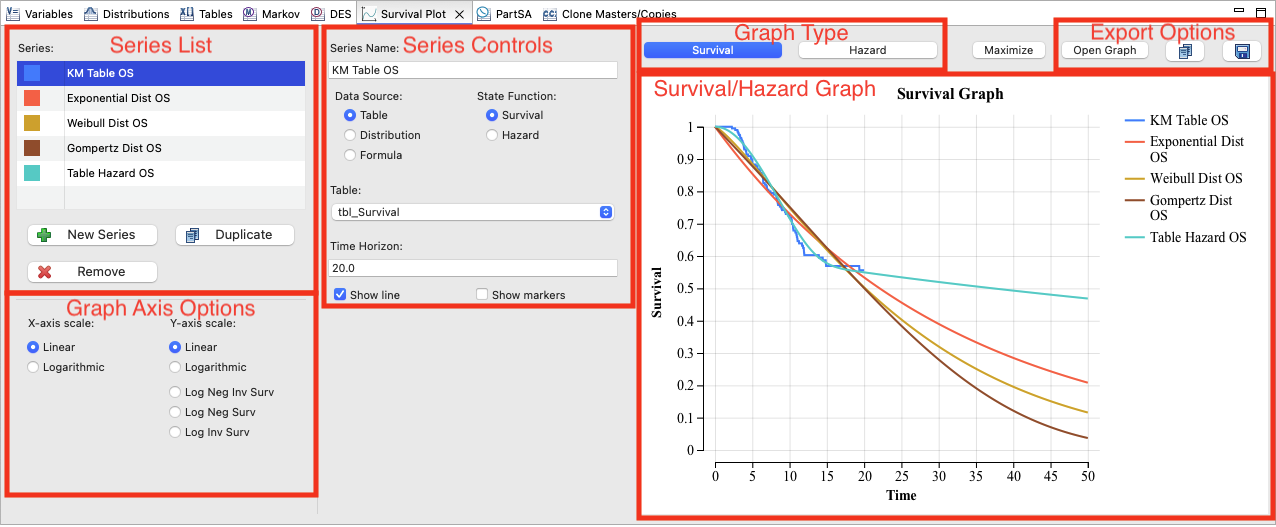
The Survival Plot View is tied to the active model, so you need the model to be the active tab in the top-left pane within TreeAge Pro. With the model active, all model inputs (such as distributions, tables, variables) can be referenced with the plotter graph being redrawn accordingly. The image below breaks down the Survival Plot view into component categories described below.
45.2.1 Series List
The Series List is used to add, duplicate and remove a series from the list.
The series selected within the list can be edited with the Series Controls as described below.
45.2.2 Series Controls
Series Controls define the selected series from the list.
-
Series Name: Enter an appropriate name for the series. The name will be presented in the list and in the graph legend.
-
Data Source: The series can be defined by a Table, Distribution or Formula.
-
State Function: Defines whether the series data represents a Survival Function or a Hazard Function.
-
Entry:The contents of this control change depending on the Data Source selection.
-
Table: Select one of the tables in the model.
-
Distribution: Select one of the distributions in the model.
Note that if a distribution is selected, it is automatically converted to a survival curve using the DistSurv function over default time. If you wish to use a distribution in a different way, use a formula instead. -
Formula Expression: Enter any expression using model inputs (variable, distributions, functions, keywords, etc.).
Entry of a formula DistSurv("DistributionName"; _time) would be the equivalent of selecting a distribution for the source.
Entry of a formula DistHazard("DistributionName"; _time) and choosing State Function "Hazard" would also be the equivalent of selecting a distribution for the source.
Entry of a formula DistSurv("DistributionName"; _time*12) would be the equivalent of selecting a distribution for the source and converting a monthly distribution time unit to annual.Open example model SurvivalPlot-Dist-Functions.trex to see the use of those distribution functions to generate identical curves in the Survival Plot View.
-
-
Time Horizon: Define the end time for the series. Different series can have different Time Horizons.
-
Show line: Check to show the line for the series.
-
Show markers: Check to show individual points in the series.
Note you can uncheck both Show line and Show markers to hide a series in the graph.
Note that when markers are shown, you can hover the mouse over any marker to see the point's x and y coordinate values.
45.2.3 Graph Type
Select either Survival or Hazard.
Survival will show declining survival curves for all selected series.
Hazard will show changing hazard/risk over time.
45.2.4 Graph Options
These options change the scale of the x-axis and y-axis in the Survival Plot View.
-
x-axis scale: Show time on a linear or logarithmic scale.
-
y-axis scale: Show survival or hazard with a number of scale options. For hazard graphs, you will likely want to stick with linear, but the additional scale options may be informative for survival.
-
Linear: Show survival on a linear scale.
-
Logarithmic: Show survival on a logarithmic scale.
-
Log Net Inv Surv: Show survival as the Log of the Negative Inverse of the Natural Log of Survival.
-
Log(-1/ln(Survival(t)))
-
-
Neg Log Surv: Show survival as the Log of the Negative Natural Log of Survival.
-
Log(-ln(Survival(t)))
-
-
Log Inv Surv: Show survival as the Log of the Inverse of Survival.
-
Log(1/Survival(t))
-
-
45.2.5 Export Options
Use the Open Graph, copy and save buttons in the top-right corner of the view to export an image of the graph.
-
Open Graph: Open the current graph in a separate graph window where formatting options are available.
-
From the separate graph window, you can export any series to a table for use in a model.
-
-
Copy: Copy the graph into the clipboard for pasting into a document (e.g., Word).
-
Save: Save the graph as an image file.
45.2.6 Sensitivity Options
Show the impact of 1-way sensitivity analysis on one or more series in the Survival Plot.
-
Sensitivity Analysis Mode: Check the box to activate sensitivity analysis mode.
-
Variable: Choose the variable to use for sensitivity analysis.
-
Base: Enter the base case value.
-
Low: Enter the low bound of the variable's uncertainty range.
-
High: Enter the high bound of the variable's uncertainty range.
The image below demonstrates the use of sensitivity analysis mode on a Compound Curve example mode.

