13.6 Sampling from tables
If it is not feasible or desirable to use one of TreeAge Pro’s built-in distributions to represent the particular probability distribution you need, there are at least two ways to create custom sampling distributions. These methods use built-in distributions and tables.
Table distributions can be helpful in defining individual characteristics of patients (i.e., gender, ethnicity) during microsimulation based on the probability of each value within the cohort.
TableProb distributions can be helpful for drawing time-to-event samples for Discrete Event Simulation based on a table of probabilities (like a mortality table).
For both types of probability table, the first and last rows in the table must have values 0 and 1, respectively. The index for these tables represents time in cycles (typically years).
13.6.1 Creating a Table distribution
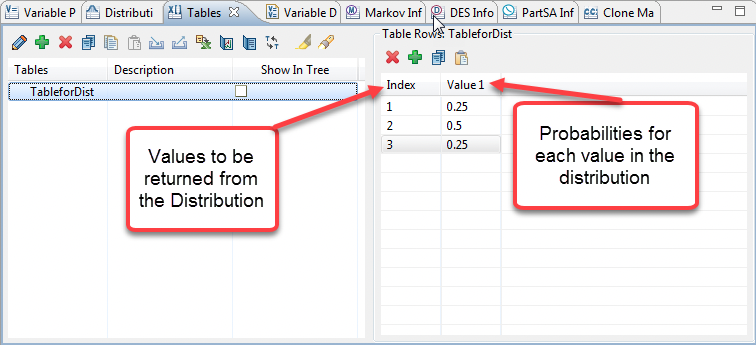
One way to sample values from a custom distribution is to create a new table in TreeAge Pro describing the distribution’s discrete probability function (not the data set). This table can then be assigned to a Table distribution.
Each row of the table defines a distribution value (entered in the index column) and its probability (entered in the value column of a table entry). The probabilities in the value column must total 1.0.
To create a Table distribution from an existing empirical data set:
-
Use the Table Properties View to create a table and populate it with data that represents the custom distribution function. Refer to the section Creating, Editing and Referencing Tables for details.
-
Within the Distributions View, click the "add" icon in the toolbar to create a new distribution.
-
In the Add/Change Distribution Dialog, select the distribution type "Table".
-
Under "Distribution parameters", select the table from the list of the model's tables.
-
Enter a name and description for the distribution. Select the appropriate sampling rate.
-
Click OK to save the distribution and close the Add/Change Distribution Dialog.
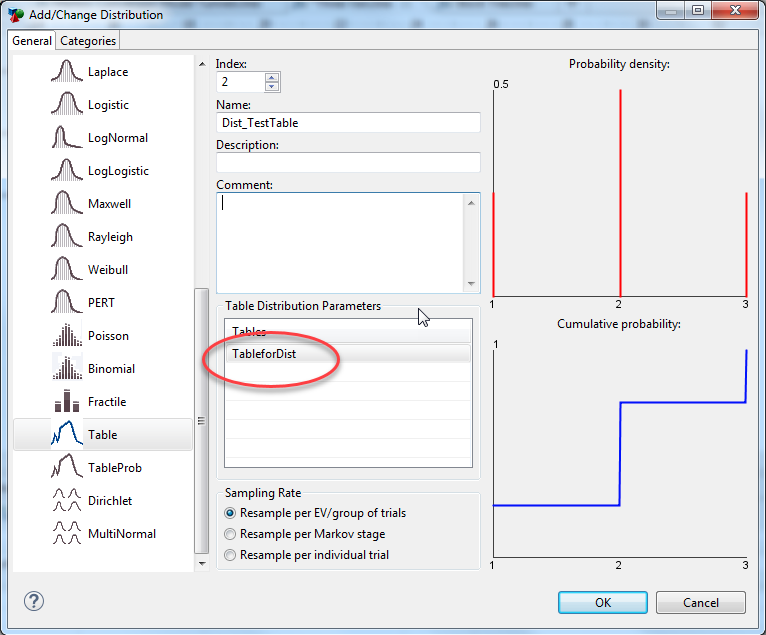
To randomly sample from the Table distribution, simply reference the distribution in the standard way: use either the distribution’s name or the Dist(n) function using the distribution’s index within the model.
Sample values will only be drawn from exact table entry indexes, regardless of which lookup method you specify. TreeAge will not interpolate in a Table distribution.
The mean value of the Table distribution will be used as the distribution’s expected value in non-Monte Carlo calculations.
You can use Dist(index; 2), Dist(index; 3), etc. distribution reference to sample based on probabilities in the second, third, etc. value column.
13.6.2 Creating a TableProb distribution
The TableProb distribution allows you to use a table of probabilities as the basis of a distribution for drawing time-to-event samples. This is particularly useful for integrating background mortality into a DES model since background mortality frequently does not conform to a parametric distribution (like Weibull or Gompertz).
A TableProb distribution uses a table as its primary parameter. The table can be either a probability table or cumulative probability table. Typically, a TableProb distribution would use a published mortality probability table.
We will use the DES Tutorial Example, TableProb Distribution.trex, which has examples of two TableProb distributions, one from a probability table and one from a cumulative probability table.
To create a TableProb distribution from a standard probability table (e.g., mortality):
-
Use the Table Properties View to create a table and populate it with data that represents a Mortality Table. Refer to the section Creating, Editing and Referencing Tables for details. In the Example model, this table is called tMortBackground.
-
Within the Distribution Properties View, click the "add" toolbar icon to create a new distribution.
-
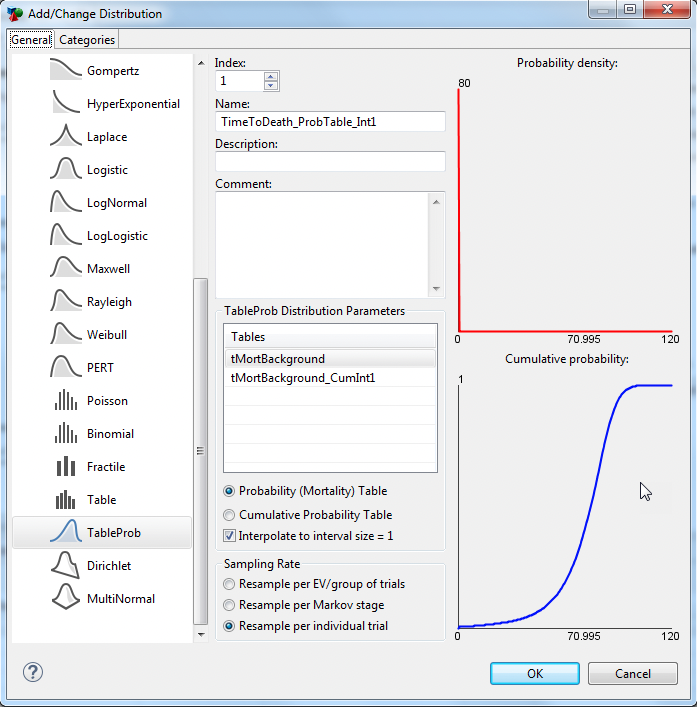
Enter a name and description for the distribution (the model uses TimeToDeath_ProbTable_Int1).
-
In the Add/Change Distribution Dialog, select the distribution type "TableProb".
-
Under "Distribution parameters", select the table (tMortBackground) from the list of the model's tables.
-
Select table type: Probability (Mortality) Table; and select: Interpolate to interval size =1, if your table does not have a row for each Index.
-
Select Sampling Rate: Resample per individual trial.
-
Click OK to save the distribution and close the Add/Change Distribution Dialog.
TableProb distributions using cumulative probability tables perform no interpolation. If you want better control than linear interpolation between rows of a probability table, you can convert to a cumulative probability table, then modify the data for a better fit for your parameter.
To create a TableProb distribution from a cumulative probability table:
-
Use the Table Properties View to create a table and populate it with data that represents a Mortality Table. Refer to the section Creating, Editing and Referencing Tables for details. . In the Example model, this table is called tMortBackground_CumInt1.
-
Within the Distribution Properties View, click the "add" toolbar icon to create a new distribution.
-
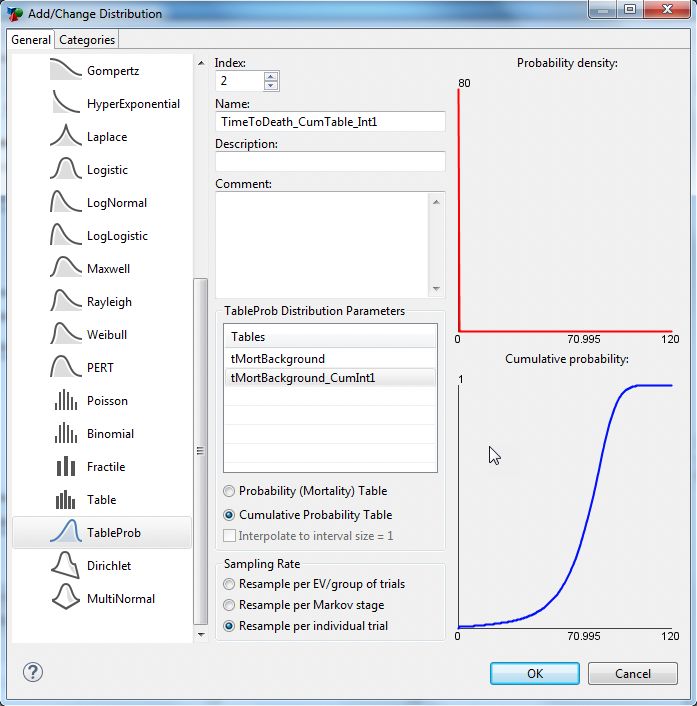
Enter a name and description for the distribution (the model uses TimeToDeath_CumTable_Int1).
-
In the Add/Change Distribution Dialog, select the distribution type "TableProb".
-
Under "Distribution parameters", select the table (tMortBackground_CumInt1) from the list of the model's tables.
-
Select table type: Cumulative Probability Table.
-
Select Sampling Rate: Resample per individual trial.
-
Click OK to save the distribution and close the Add/Change Distribution Dialog.
Sampling from a TableProb distribution
You can reference the distribution anywhere in your model to use a sample during simulations. The internal mechanism performed during the sampling is described below.
When a TableProb distribution is sampled, a random number between 0 and 1 is drawn. That random number is then used to do a reverse lookup in the values in the cumulative probability table, returning the appropriate index value.
If the TableProb distribution references a probability table, that table is internally converted to a cumulative probability distribution (with or without interval interpolation) prior to the reverse lookup described above.
We will review the DES Tutorial Example, TableProb Distribution.trex, which has examples of two TableProb distributions, one from a probability table and one from a cumulative probability table. In the example model there are two tables:
tMortBackground: A probability table with sparse index entries. The first value starts at 0 and last value ends at 1, see tMortBackground in the figure below.
tMortBackground_CumInt1: The cumulative probability table (from tMortBackground).
For both types of probability table, the first and last rows in the table must have values 0 and 1, respectively. The index for these tables represents time in cycles (typically years).
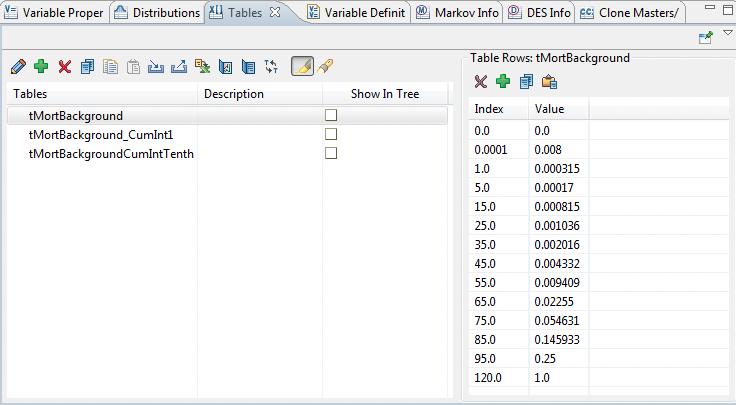
Converting between probability tables and cumulative probability tables
Depending on the data available you may want to convert between probability and cumulative probability tables.
-
In the Table View select the table to convert.
-
In the toolbar of the Table View, select the icon "Convert Table".
-
Using the Convert Table dialogue to give the new table a name.
-
If converting from a probability distribution with sparse indices, choose the option "interpolate the interval size = 1" which will create an entry at every index.
-
Select OK to close and create the new Table.
The interval size of "1" mimics interpolation in a standard table lookup. Using this interval, the resulting cumulative probability table will include index values for every year with the cumulative probability interpolated from the closest rows in the probability table.
The same conversion logic used to create a cumulative probability table directly is used implicitly when you create a TableProb distribution using a probability table.
13.6.3 Using a distribution to look-up values in a table
There are situations where distributions cannot be easily represented using a standard distribution type, or a regular Table distribution as described above.
For instance, perhaps you have a table of age-dependent probabilities or costs that you want to do a probabilistic sensitivity analysis on. Or, you might have a set of observed parameter values that you want to bootstrap from with each row’s value given an equal probability (or even selected in order).
In these cases, you could populate the table and then use a separate distribution to sample row indexes and/or columns indexes.
For example, you could fill a table with observed data, numbered from 1 to N, and then pick values randomly from the table using a uniform distribution with a range equal to the range of table indexes. In this case, use the integer form of the Uniform distribution (to return only integers in the index range).
To sample from a table using a Uniform distribution:
-
Enter/paste your data set into a TreeAge Pro table, using consecutive integer indexes in the index column and the data set’s values in the value column.
-
Within the Distribution Properties View, click the "add" toolbar icon to create a new distribution.
-
In the Add/Change Distribution Dialog, select the distribution type "Uniform".
-
For the low value, enter the lowest integer index from your table (i.e., 0 or 1). For the high value, enter the highest integer index from your table.
-
Enter a name and description for the distribution.
-
Click OK to save the distribution and close the Add/Change Distribution Dialog.
The actual reference in a tree formula should look something like the following:
-
TableX[Dist(1)]
where “TableX” is the name of the custom distribution table, and inside the square brackets is the reference to the Uniform distribution (assumed to have the index 1 in the example above). During a second-order simulation, the Uniform distribution will be re-sampled within its range, causing different rows from TableX to be drawn randomly with an essentially equal likelihood if done correctly.
It may also be possible to pick rows from the table in order during a simulation by using the keyword _sample (for sampling, use _trial for microsimulation) in place of the Uniform distribution. The _sample counter corresponds to the current iteration of the probabilistic sensitivity analysis simulation, incrementing by one at each re-sampling iteration.
To pick from a particular column in a multi-column table, simply add the appropriate column parameter to the table reference, such as:
-
TableX[Dist(1); 2]
To convert a time-dependent table of values for sampling, you might add additional columns that represent percentiles or bounds of each row. Then, you would use a distribution to sample a column index (i.e., between 2 and 3):
-
TableX[_stage; 2+Dist(1)]
