43.15 Patient Tracking Reports for DES Models
Patient Tracking Reports are described in detail in the section: Patient Tracking Reporting for Microsimulation. However, Patient Tracking Reporting is also possible for DES models as described here.
Patient Tracking Reports allows you to record data updates during Microsimulation, then generate reports based on the time-based data. In this section, we will examine Patient Reporting in the DES tutorial example model DES.Model.With.RepeatingEvents.
The model is already setup to record all data items for Patient Tracking Reporting within Tree Preferences. For details on how to setup Patient Tracking Reporting, refer to the Configure the Model for Patient Tracking section. After running Microsimulation on the model, note the Patient Tracking Reporting options (on the right hand side under Data Reports).
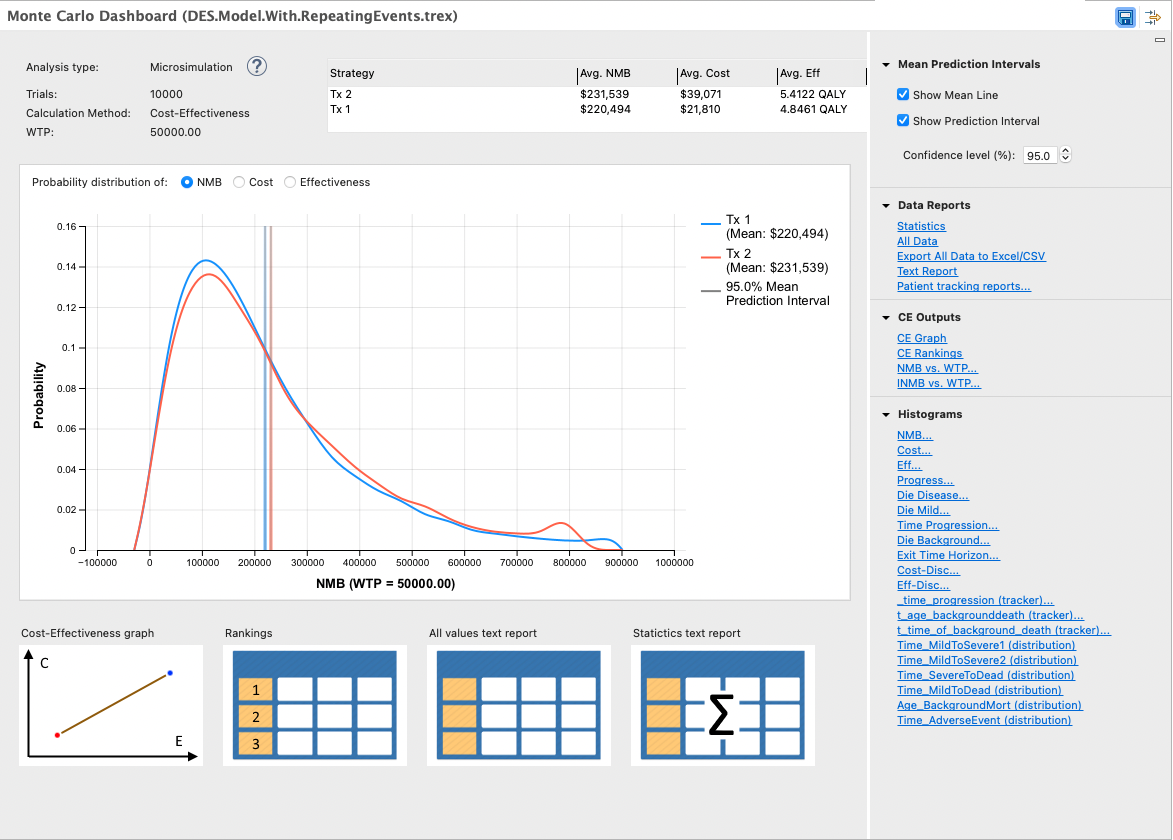
All report options are described in the Patient Tracking Reporting for Microsimulation section.
First will focus on how to use the Trial (per strategy) report to verify the DES model is running as designed. Then we will look at how the Cohort (per strategy) report is compiled.
Trial Report (per strategy)
The Trial Report (per strategy) provides a details on how each individual passes through the model to track patients. The report uses a similar format to the Markov Cohort Extended Report; however, the data is shown for one individual at a time. In this model these are the reports called Trial (Tx 1) and Trial (Tx 2).
Time reporting records the path of each trial by Stage and Node. The Trial Report provides a trace of a single trial's path in a familiar format. If a node is shown, that patient passed through that node in its path. The report follows the path of each trial until its path is complete.
We consider the Tx 1 Strategy, one of the two strategies in this model. From the Time Reporting options, select the Trial (Tx 1) report and it generates the Monte Carlo Time Trial Report as in the figure below (shown for trial 2).

In the figure below, the Monte Carlo Time Trial Report (for Tx 1 strategy) is highlighting distributions and trackers columns further to the right.

The columns in the Trial Report are the same for all Trials, but the number of stages and the states/transitions for each trial will be different.
Due to the nature of a DES model, the column for each Stage represents where an event has occured. (DES models do not have fixed time stages due to the continuous nature of time.) The additional Time column records the time each event occurs.
For example, in the report above Trial 1 progresses as follows:
-
Stage 0 - Equivalent to Time 0 - 1.906: Trial waits at the Mild node and then progresses to Severe. Cost and Effectiveness are accumulated at the Mild node from time 0 - 1.906. Cost of Progression at Mild ToSevere is added at time 1.906. Trial moves to the Severe node..
-
Stage 1 - Equivalent to Time 1.906 - 2.798: Trial waits at the Severe node until an Adverse Event occurs at time 2.798. Cost and Effectiveness are accumulated at the Severe node from time 1.906 - 2.798. There is a cost associated with the Adverse Event of 3,000 and it is added at time 2.798. Trial returns to the Severe node.
-
Stage 2 - Equivalent to Time 2.798 - 4.133: Trial waits at the Severe node until Death at time 4.133. Cost and Effectiveness are accumulated at the Severe node from time 2.798 - 4.133.
-
Stage 3: Exits model via Dead.
The example above shows how the cost and effectiveness changes for each event. Note changes to trackers and distributions can be seen scrolling further to the right in the Trial Report. This is important where we have distributions which need to be resampled at a given node for the next event.
Cohort Report (per strategy)
The Cohort Report (per strategy) provides details into the flow of individuals through the model. This report is very useful when validating that patietns are moving through the model in a way that accurately represents the underlying disease and treatment.
The report uses the identical format as the Markov Cohort Extended Report; however, the data is generated by rolling up the continuous time for patient events into discrete time steps.
When patiens run through a DES model, events could happen at any time, so aggregation is necessary to show general movements of patients at the cohort level. The aggregated data is then presented as percentages of the cohort and reward accumulation at the beginning of each time period just like the Markov Cohort reports.
Consider the following example.
-
A simple DES model contains two health states - Alive and Dead.
-
We run 5 patients through the model, and they die at the following times:
-
At the beginning of each year, the percentage of the cohort in each state is presented below.
-
1.2 years
-
1.8 years
-
2.3 years
-
2.9 years
-
3.5 years
-
Year 0: Alive 1.0, Dead 0.0
-
Year 1: Alive 1.0, Dead 0.0
-
Year 2: Alive 0.6, Dead 0.4
-
Year 3: Alive 0.2, Dead 0.8
-
Year 4: Alive 0.0, Dead 1.0
-
Consider the time at the beginning of Year 2 above - the first 2 patients would have died by then, but the last 3 would still be alive, resulting in the percentages presented above.
We will use the same analysis data from the DES tutorial example model DES.Model.With.RepeatingEvents to examine the cohort-level reporting. From the Time Reporting options, select the Cohort (Tx 1) report to generate the cohort report show in the figure below.
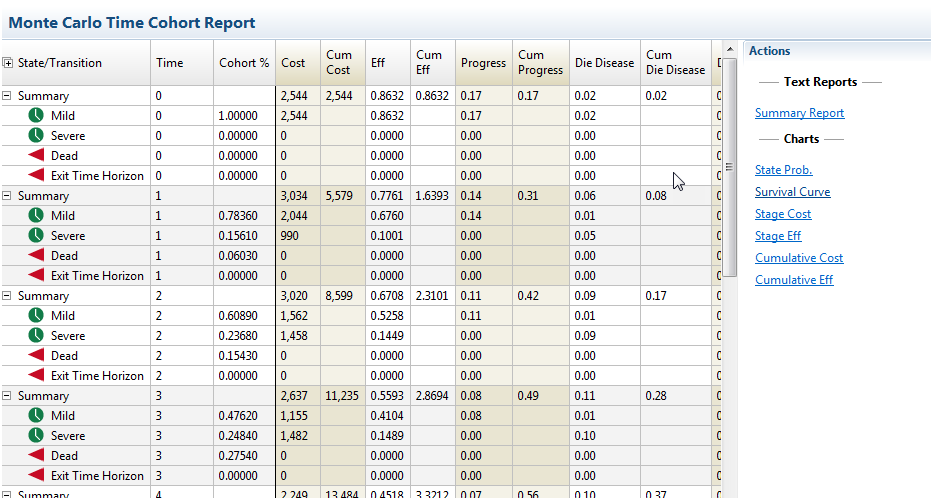
The report accumulates rewards, trackers and payoffs based on the specific node and cycle dependent on the percentage of overall trials. The percentages and the rewards are derived from the actual numbers of trials in each state at the rolled up discrete time step (0, 1, 2 etc) and also the rewards accumulated for each trial in each state.
For example, since 10,000 trials were run through the model, 7836 trials were still in the Mild state at the beginning of _time 1, resulting in a cohort percentage of 0.7836. Those 7836 trials, generated a cost of 20,440,000 at the Mild node, which is shown as a percentage of 10,000 trials with the value 2,044.
The summary data at the bottom of the report shows the final breakdown of the 'cohort' from microsimulation among states including the source of all reward data.
In the Cohort report, details of all the payoffs and trackers are shown by scrolling to the right (as in the figure below).
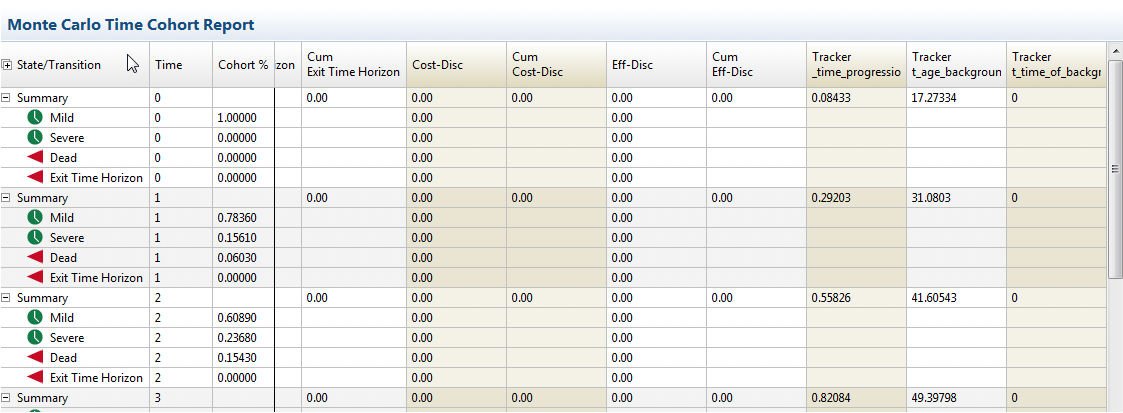
The secondary reports on the right-hand side also present the aggregated data for all trials in the microsimulation into cohort type graphs. More details about these graphs can be found in the section: Secondary - Markov Cohort Graphical Output since the output uses the same format.
All Data report
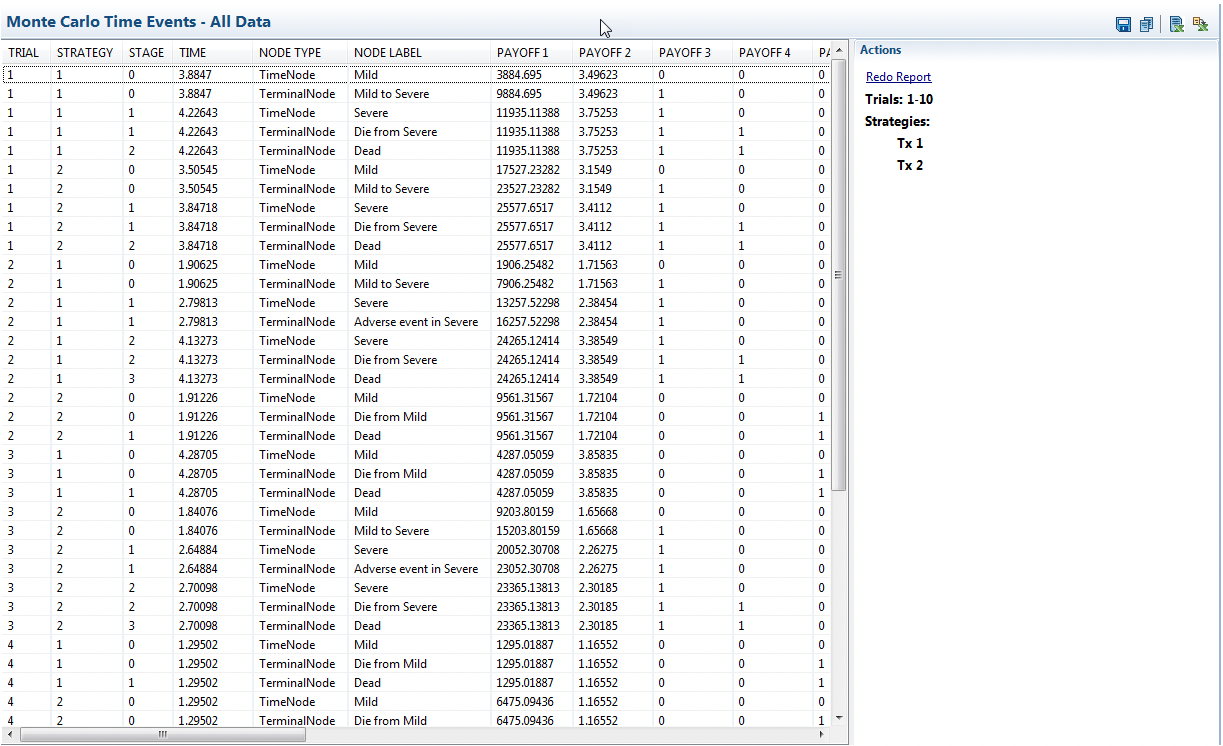
This section focuses on the All Data time report, which outputs all data values selected for time reporting. In most cases, the Cohort and Trial reports will provide what you need in a familiar format; however, the All Data time report literally includes "all data". If you want to examine data not included in the Cohort and Trial reports, this All Data time report may be useful. Later in this section, we will export the All Data time report to Excel for formtting and calculations that are helpful in verifying that a DES model is running as designed.
Generate the All Data Time Report using the following parameters to choose the first 10 trials for both strategies.
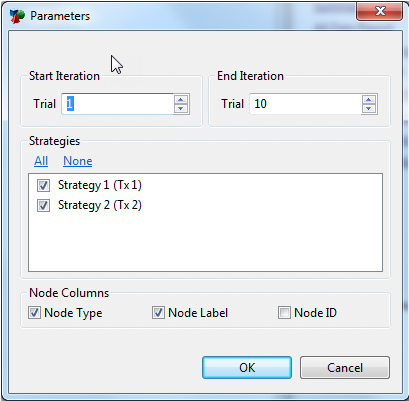
The resulting report is displayed below.
If you wanted to generate some customized reporting based on patient pathways, you might export this report to Excel or another program.
