43.8 Using a TableProb Distribution for Time-to-event from a Mortality Table
Most time-to-event values can be sampled from standard parametric distributions like Exponential and Weibull. However, your model may require a time-to-event value that does not match well to a parametric distribution (e.g., background mortality).
The TableProb distribution type allows you to create a distribution based on a series of probabilities that vary by time. The probabilities can be entered in their natural form (likelihood the event occurs in a specific cycle of time or as cumulative probability (likelihood the event has occured by a specific time).
The DES Tutorial Example model, TableProb Distribution.trex demonstrates this technique.
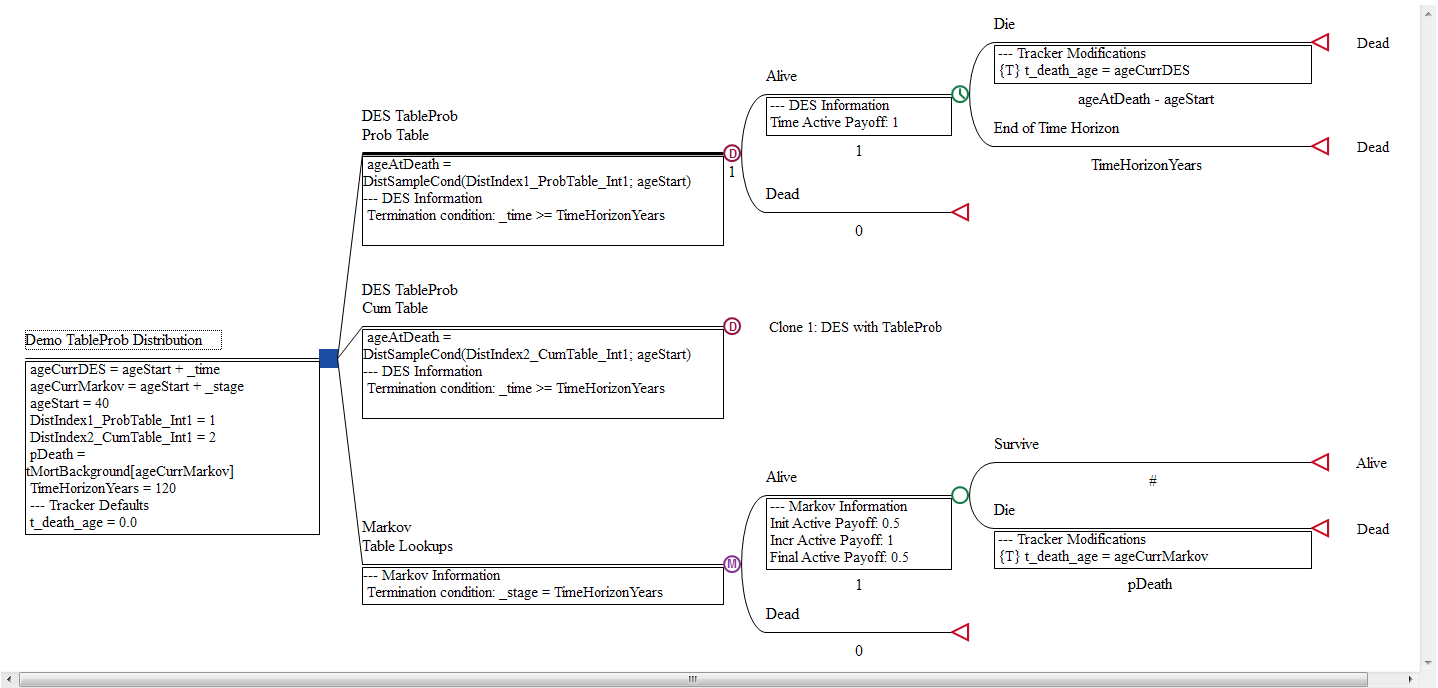
The model contains a mortality table (look at the Table View) named tMortBackground, which would be referenced directly in a Markov model. However, in this DES framework, it must be converted into a distribution for time-to-event samples to be sampled.
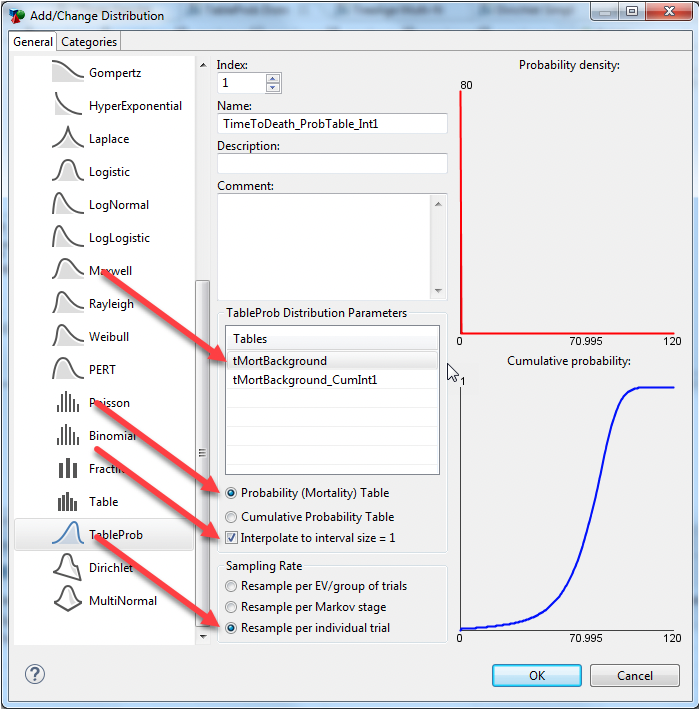
These are the attributes of the distribution.
-
The primary parameter is the table that holds the probabilities.
-
Choose the radio button for probability vs. cumulative probability based on the table data.
-
Interpolate to interval size 1 based on missing age values in the mortality table (nearly always check this box). Our table does not have a value of each age, so we select this box to interpolate correctly.
-
Resample for each individual in the model (standard practice for a microsimulation model).
Note: For a Table Distribution to work via a closed form solution, your table must start with a value that has a probability zero (in the first row) and end with a value with probability 1 (the last row).
In this example, the probability of death at age 0 is 0, but that is immediately followed by a probability of death at age 0.0001 of 0.008. The probablity of death at age 120 is 1.0.
You can generate a histogram of 10000 samples from this distribution using the Graph It toolbar button. The histogram will help us understand the samples generated by this distribution.
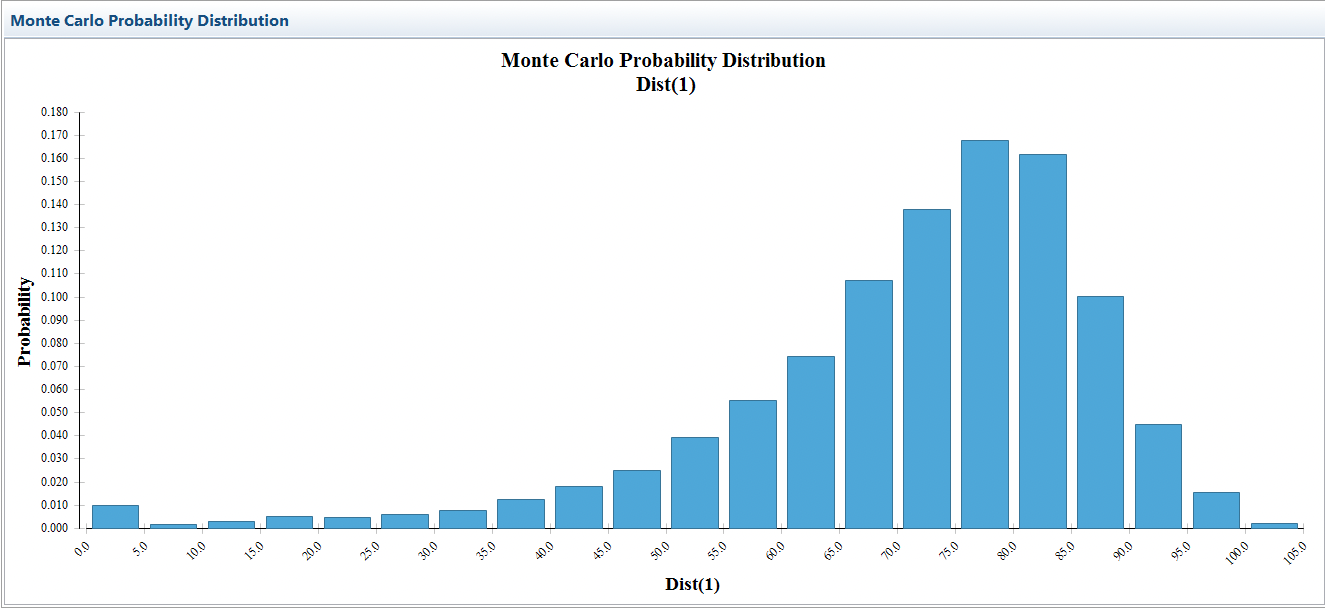
Note that about 1% of people will die before age 5, but then the probability drops and remains low until people reach middle age.
From the distribution, we can generate an age of death. However, this does not fully meet our needs if patients enter the model at any starting age other than zero. The next section on Conditional Distribution Sampling will help us handle non-zero starting age, that is sampling this distribution to start at a given (non-zero) age.
