36.5 Infectious disease cohort model
Infectious disease models in TreeAge Pro can be run as either cohort or microsimulation (parallel) trials analysis. This section looks at an Infectious Disease model analyzed via Cohort Analysis.
Infectious disease models are a specific class of models because they depend on the current membership of the health states, which impact the transitions between health states. Simply, the number of people in the infected state impacts the likelihood of an uninfected person becoming infected.
This example is a Susceptible–Infected–Recovered (SIR) epidemiological model, which computes the theoretical number of people infected with a contagious illness over time. The name of this type of model derives from the set of health states: number of Susceptible people (S), number of people Infected (I), and number of people who have Recovered (R). Transitions from one state to another in the model can be derived mathematically, and while the derivation is out of scope of this manual, more details can be found here.
36.5.1 SIR Model structure
Consider the Healthcare tutorial example, Dynamic Cohort - Infectious Disease.trex, shown in the figure below.
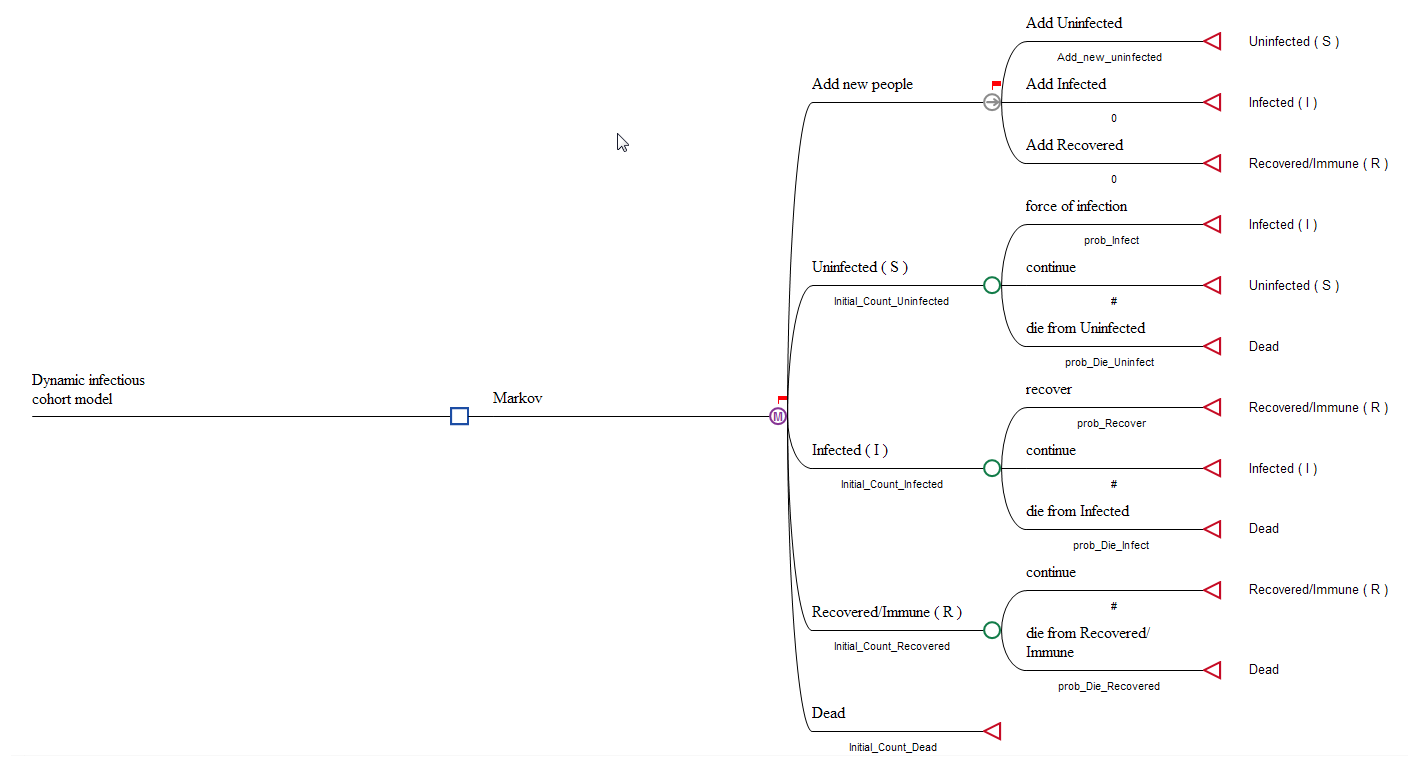
Standard SIR models often do not have vital dynamics (that is no Births and Deaths) because the dynamics of an infectious disease are often much faster than the birth and death rate. In that case, the total population does not change.
In this example, we are showing the basic SIR model with vital dynamics (that is Births and Deaths). This will demonstrate how to add new people into the Dynamic model via the Entry Node.
Consider the following elements of the model:
Entry State
The Entry State is described in detail earlier in the section Entry State. In this model the Entry State adds new people into one of the three Health States: Uninfected (S), Infected (I) or Recovered (R). The number of new people is controlled by the values under each of the branches from the non-coherent Entry Node.
In this model we have the variable Add_new_uninfected adding new people into the Uninfected Health State. The model can add patients to the other states by changing the values under each branch. For example, this might be required in a situation where immunity is only provided from birth for a limited period of time.
This node would not be required in the closed version of the model, that is without vital dynamics.
Non-coherent Markov node
The Markov node is set to be non-coherent to allow the cohort size to be greater than one and set using the Initial Probabilites of the Markov node. Non-coherence is set at the Markov node by selecting the node, right clicking and then selecting Change Coherence from the menu. More details are provided in the section Cohort Size greater than one.
The initial probabilities at this Markov node are controlled by 4 variables: Initial_Count_Uninfected, Initial_Count_Infected, Initial_Count_Recovered and Initial_Count_Dead.
Changing these initial values can impact the speed of infection.
Deaths in every health state
This example model includes vital dynamics, which means we need to account for deaths which could occur at every health state. In the closed version of this model, the model would finish with all the population in the Recovered state and each health state would only have the option of progression to the next health state or remaining in the existing one.
36.5.2 Calculation of Transition Probabilities
The important mathematics of the SIR model is the relationship between the rates of change to different health states and the proportion of the population in those health states. The specific rates of change included in the calculations are the rates of infection, recovery and death.
The Markov model requires transition probabilities to determine the state membership from one cycle to the next. These transition probabilities are entered below the branches of the Health States. Calculating the probabilities in the model uses the function RateToProb(Rate ; time) to convert the rates to probabilities.
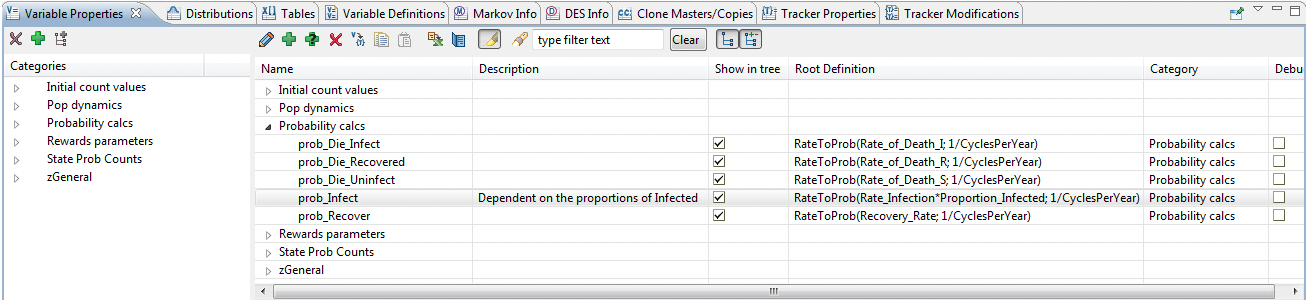
The Variables defined for these calculations are all included in the Variable Category 'Probability Calcs' as shown in the figure below.
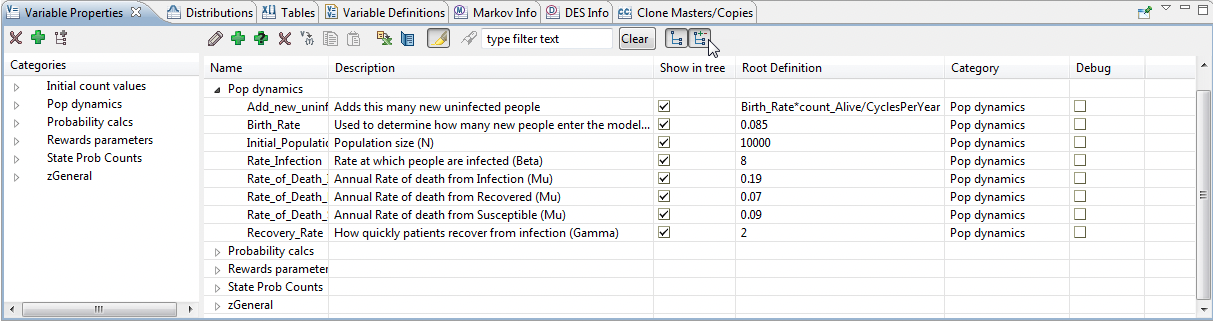
The parameters for rates of change and other Population Dynamic specific values are included in the Variable Category 'Pop Dynamics' as shown in the figure below.
Let's specifically examine the calculation for the probability of infection.
prob_infect = RateToProb(Rate_Infection*Proportion_Infected; 1/CyclesPerYear)
Note that the probability is impacted by Proportion_Infected, which represents the number of people who are infected as proportion of the number of people who are alive. This is calculated through the following calculations.
Proportion_Infected = count_Infected/count_Alive
count_UnInfected = StateProb(2)
count_Infected = StateProb(3)
count_Recovered = StateProb(4)
count_Alive = count_Infected+count_UnInfected+count_Recovered
The StateProb function returns the count of people in the appropriate state (counting down from the top). Therefore, Proportion_Infected returns the count of people in the infected state (2) divided by the count of people in any of the alive states (2 to 4).
Changing these Population Dynamic parameters will change the proportion of the population in each health state. The outputs can be seen in the next section.
In this cohort model, the Add_new_uninfected variable adds the appropriate number of people based on the formula, which may not be a whole number. This makes the model results smooth. See the next section about running individual (whole) trials through the model via microsimulation (parallel trials).
36.5.3 Analysis
This Dynamic Cohort model can be run using Markov Cohort Analysis. The model does not require microsimulation because the model uses the StateProb() function to determine the proportion of the cohort in each Health State.
The Markov node is set for non-coherence which indicates the analysis should use actual counts rather than percentages of the cohort. The counts will be reported in the analysis.
To run Markov Cohort Analysis, select the Markov node and then run Markov Cohort Analysis from the toolbar. The figure below shows the Markov Cohort Dashboard.

From the Actions on the right hand side, select the State/Event Cohort Details as in the figure below.

The figure shows the different 'counts' being added by the 'Add new people' Entry node. Looking at the Cost Entry and Eff Entry columns the zero values indicate there is no impact on cost or effectiveness from the Entry state.
In this model, there are only new people added to the uninfected state based on the Birth Rate and the number of the cohort Alive. The numbers in the Cohort # column can be used to confirm the cohort are moving to the correct health state based on those entering and leaving the health states.
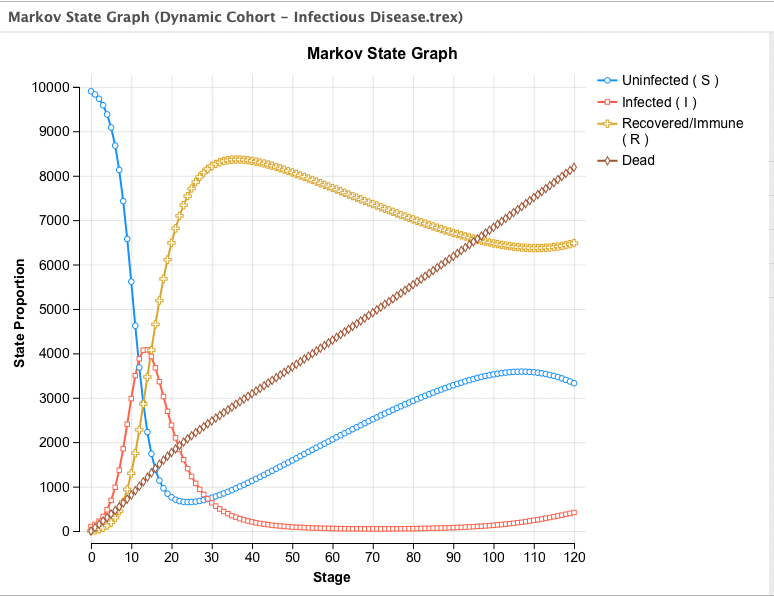
From the Graphs on the right-hand side we can generate the usual State Prob curves. In this Dynamic model, because the Markov node is non-coherent, the reports use actual counts rather than percentages, as in the figure below.