51.6 Constructing an influence diagram - adding arcs
Arcs were introduced as a means of displaying the relationships between actions, variables, events, and objectives.
An arc ending in an arrow is drawn between two nodes to indicate that:
-
the first event precedes the second event; and/or
-
the first event or action affects (or conditions) the second event.
Some examples of these arcs could be:
-
An influence arc might indicate that the probabilities for one event depend on the outcome of a prior event or action.
-
An influence arc might also indicate that an action or event makes some contribution to, or deduction from, the final objective (e.g., project cost, or profit).
The direction of influence between the two nodes added so far is from the Investment Decision to Profit, so an arc should be created that points from decision node to the value node.
To draw an arc:
-
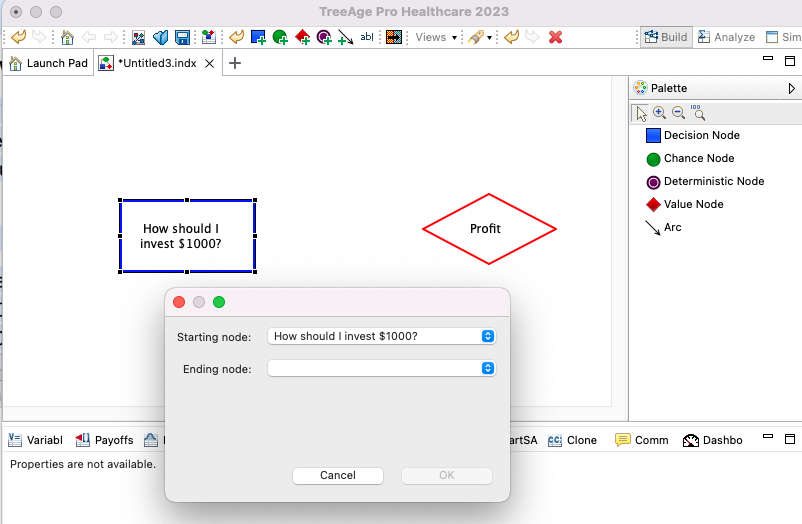
Click on Arc in the tool bar.
-
A window will appear asking for the Starting node and the Ending node.
-
The Starting node will be: How should I invest $1000? And the Ending node will be: Profit.
-
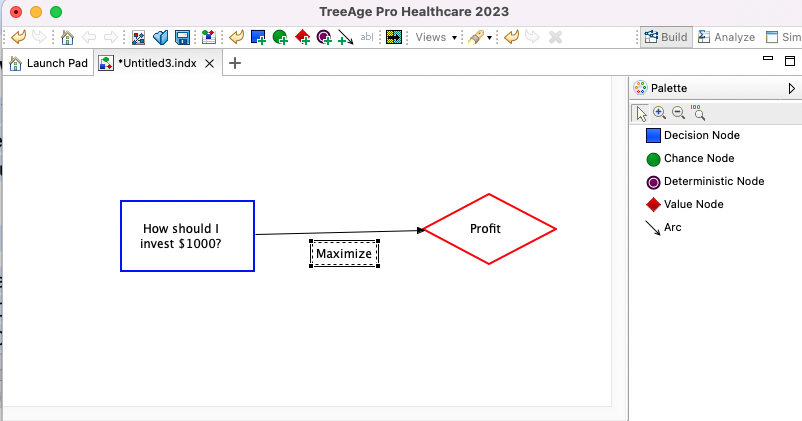
Click "OK" and a new Arc will be added.

It is frequently useful to add a comment to a label to describe the influence relationship represented by the arc.
To edit an arc label:
-
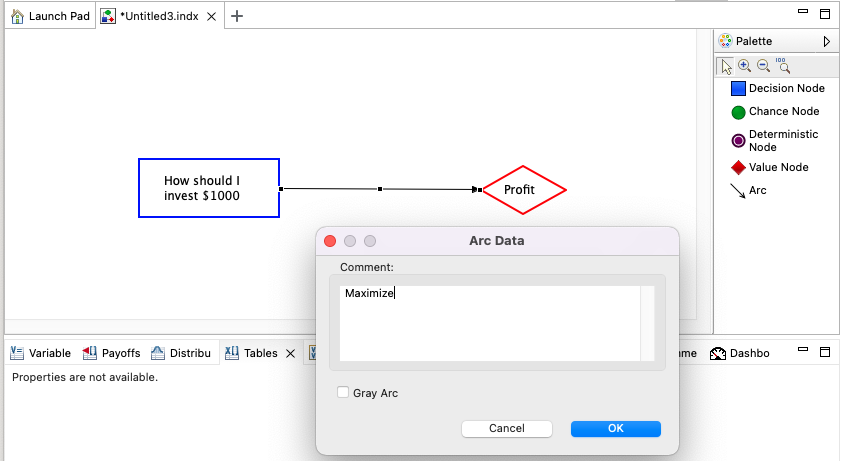
Double-click on the arc.
-
Enter text ("Maximize") into the Arc Data dialog Comment field.
-
Click OK.
The arc label can also be moved closer/further from the arc.

To move an arc label:
-
Click on an arc label and drag it to a new location.
As the arc moves relative to its source/destination nodes, the label will automatically move with it.

The influence diagram is not yet completed and we need to add the last node and arcs associated with it.
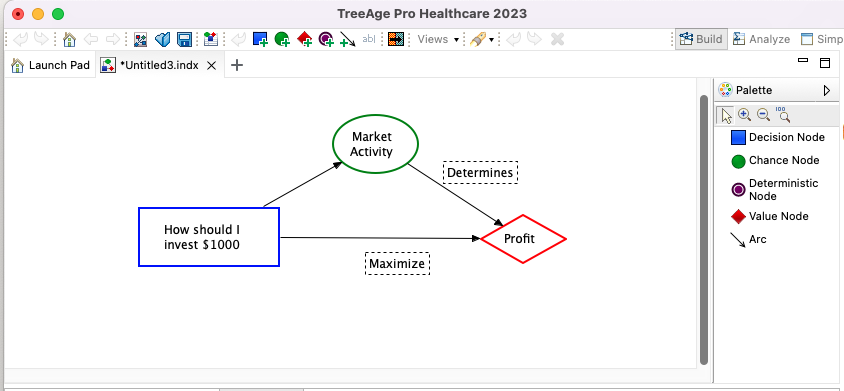
Add a chance node representing the risk inherent in choosing the stock — and its influence arc.
-
Add a chance node (green circle), and for the node name enter Market activity. You may want to place this above the other two nodes (as in the figure below).
-
Add an arc from Market activity to Profit and enter the label "Determines".
-
Add an arc from How should I invest $1000 to Market Activity to indicate the order of actions within the influence diagram.
Here is essentially how your three-node influence diagram should now look:

Now that all nodes and arcs have been added, take a moment to save your document. You save, open, and close influence diagrams and other documents in TreeAge Pro the same way you do in other programs — using the File > Save As command. Influence diagrams are saved with the file extension *.indx rather than *.trex.
