5.6 Analysis of a decision tree
With all the elements in place: 1. Model configured, 2. Tree structure created, 3. Numeric values entered, then the final part is to analyze the model. If you have not built the model, you can open the finished model: Cancer Decision Tree.trex.
The quickest way to run analysis on a cohort model is to perform Rollback. This will show the model can be analyzed, it will provide the Expected Values for each strategy, and also the optimal strategy based on the Willingness-to-Pay (WTP).
To Rollback the model:
-
Select the decision node. Click on the beach-ball in the tool bar.
-
..OR
-
In the Analysis menu, select Rollback.
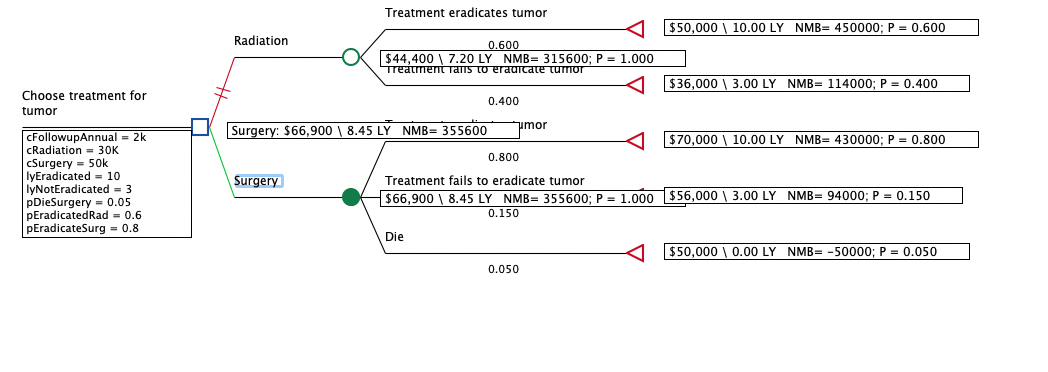
The model, Cancer Decision Tree.trex, below is rolled back showing the calculated values for all the entries in the model, including probabilities, cost and effectiveness. In addition, for each scenario we can see the Net Monetary Benefit value and the path probability on the right hand side.

Reviewing the rolled back model, the optimal strategy is determined compared to the WTP and is highlighted in green. In this case, the strategy of Surgery is optimal.
What does rollback do?
For models with the Calculation Method “Cost-Effectiveness”, expected values are calculated separately for the cost payoff and the effectiveness payoff. Both sets of expected values are critical to decision making. Expected value (EV) calculations start by calculating the payoff values at each terminal node. We just entered fixed numeric values, so those calculations are simple.
At chance nodes, the EV is calculated as the weighted average of the EV of its branches, i.e. the sum of the EV of each branch multiplied by its probability.
At decision nodes, the optimal path branch is selected based on the calculation method. Our calculation method is “Cost-Effectiveness” (two active payoffs). The optimal strategy is the strategy with the highest Net Monetary Benefits (NMB) based on cost-effectiveness analysis methodology. Net Monetary Benefits are described in detail in the Cost Effectiveness Modeling chapter.
The optimal strategy will be highlighted with a green branch connector. All rejected strategies are highlighted with a red branch connector with a double "strike through" marker. If a strategy were excluded from the analysis, its branch connector would be colored gray.
If TreeAge Pro displays an error message, examine the text for the course of the problem. Possible problems include endpoints that are not terminal nodes, and missing probability or payoff values. The error message should tell you where the error is. (If not, let us know at support@treeage.com).
Note that changes cannot be made to structure or values while Roll Back is on. Roll back is on when the tree looks as in the figure above and the beach ball icon is “depressed” in the toolbar.
To turn off roll back display:
-
Select Analysis > Roll Back from the menu.
-
... OR...
-
Click the "beach ball" icon in the toolbar.
WHAT NEXT?
-
We would suggest looking at one of the other model building sections such as: Building Markov Models, or you can get more information about Navigating TreeAge Pro.
