51.2 Structure of the Workbook
The Excel model recreates everything in the TreeAge Pro model required for calculation. The following table provides a cross-reference between each element of the Excel model and its equivalent within the TreeAge Pro model.
| Excel model |
TreeAge Pro |
|---|---|
|
Inputs & Results |
Variables View and Distributions View Ranking report and CEA graph |
|
1. Strategy Calcs (for each strategy) |
Markov Cohort Analysis Extended Report (for each Markov model) Markov Probability (State Prob) Analysis graph |
|
State Trans Diag |
Image of TreeAge Pro State Transition Diagram |
|
Input Tables |
Tables View |
|
Original Data and Results (including option to Restore original model inputs) |
Restore: Set the Excel model back to its initial values when exported from TreeAge Pro. Original model inputs as on Variables View and Distributions View Rankings report |
|
1.1 State Details (for each strategy and state) For Single Sheet Export option, the State Details are consolidated into a Strategy Results sheet |
Markov Cohort Analysis Extended Report |
|
Time Calcs |
Any element of the model referring to _stage (such as tables or variables) |
|
Time Discounting |
The discounted value used for each payoff per cycle |
The remainder of this section will describe each Excel worksheet in more detail.
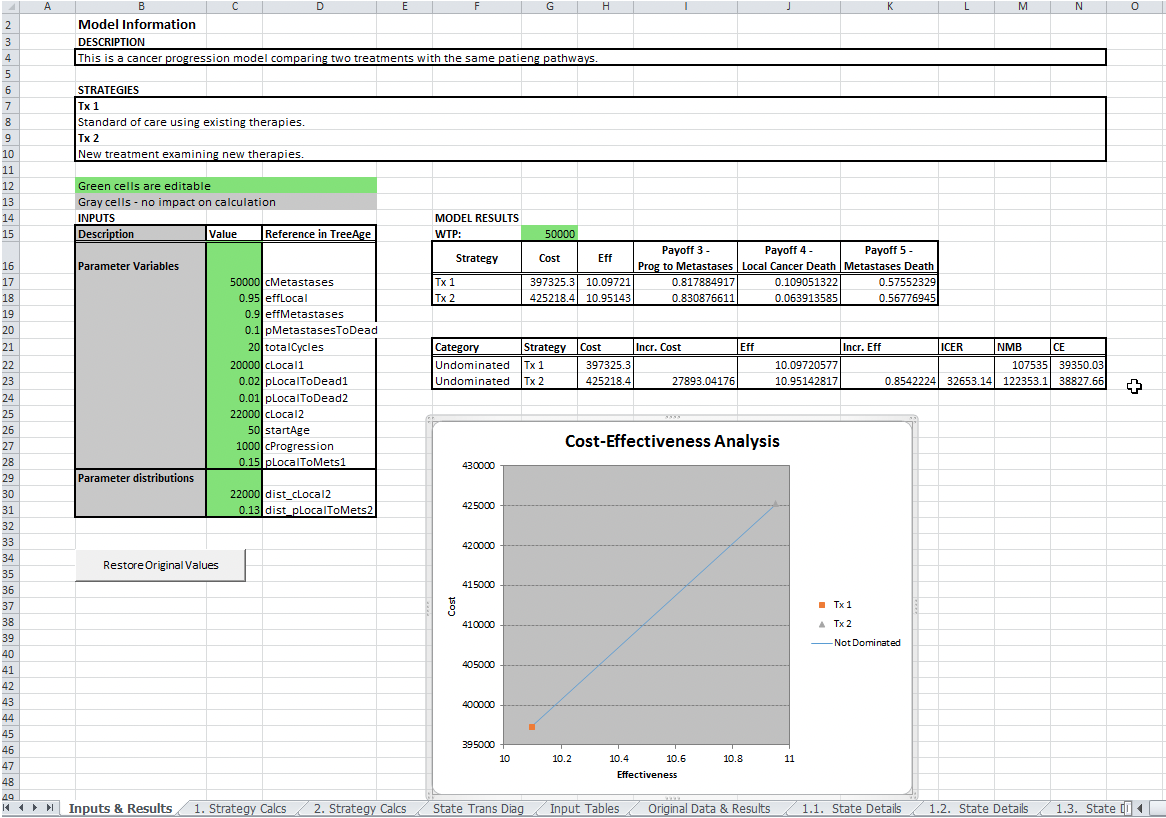
51.2.1 Inputs & Results
This sheet provides the main model inputs and results. In this example model, this includes:
-
Model description: As completed when converting the model, any information about model description and strategies is shown here.
-
Inputs: Data from the Variables View and from the Distributions View.
-
Restore Original Values: This button will restore the original values (as in the Inputs table) to the Excel model, resetting the original model values.
-
Results: Two tables, one with the results from least to most costly, the other ranking the results considering dominance with ICER and NMB calculations. The CEA graph is displayed below the table.
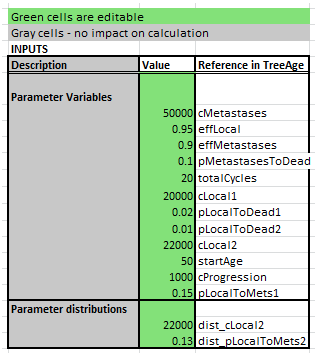
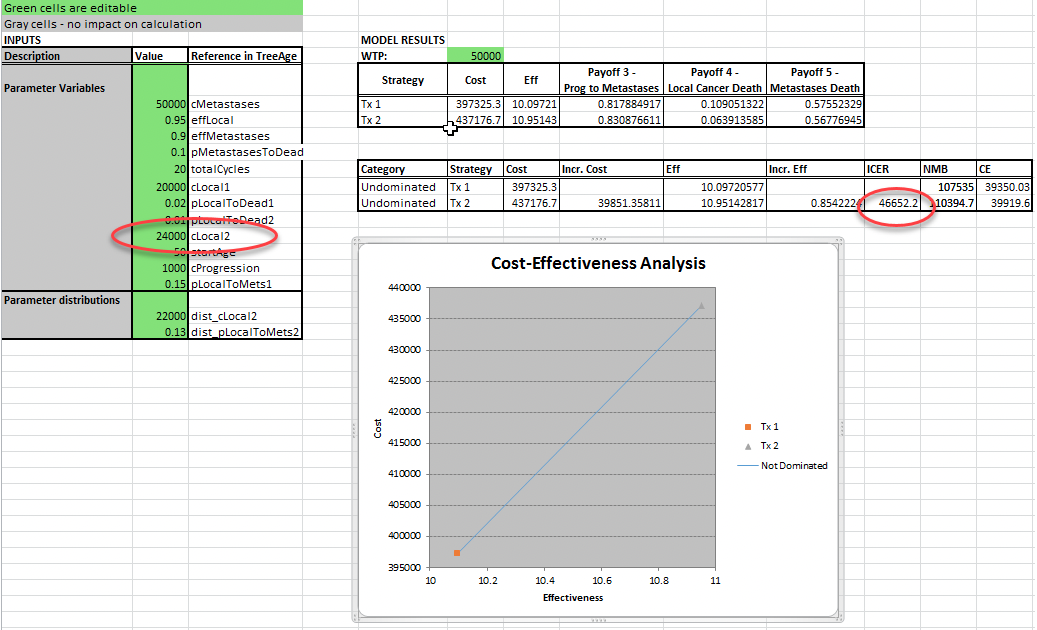
Inputs
The figure below specifically shows the section of the Input & Results worksheet highlighting the input parameters.
The values in the green cells can be edited. They are named cells used in formulas within the Excel model’s cohort analysis worksheets. You can change any input highlighted in green to generate new results for the Excel model.
Each input has a Reference in TreeAge which is either the variable name or the distribution, depending on its original input type in the TreeAge Pro model.
Distributions are presented with their mean values as the input value. That is consistent with the use of distribution means in TreeAge Pro when not sampling distributions during Monte Carlo Simulation.
Model Results
In the Inputs and Results worksheet, there are model results. There are three main sections:
-
Table with the model results, including the option to edit the Willingness To Pay (WTP) in green. The expected values for each strategy sorted from least costly to most costly. The expected value for the active payoffs (cost and effectiveness for a CE model) are displayed first, followed by additional payoffs if enabled via Tree Preferences.
-
Table with the ranking results. The table accounts for dominance among strategies, and places dominated strategies at the bottom. Incremental cost-effectiveness ratios (ICERs) and net monetary benefits (NMB) columns are included in this table as part of a more robust presentation of cost-effectivenss results.
-
Cost Effectiveness Analysis graph, generated from the values in the tables.
The WTP is an editable field (green) which will change the NMB for the model. At a given WTP, the most cost-effective strategy will always have the highest NMB value, regardless of dominance.
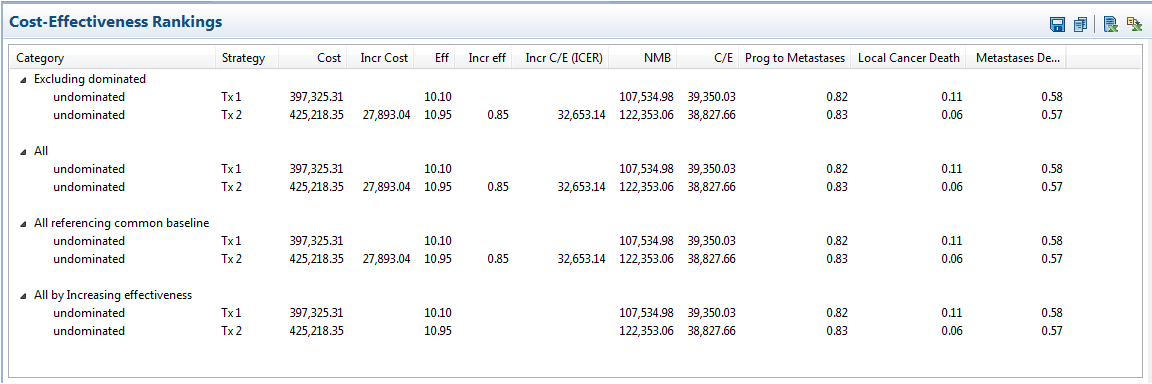
Below is the Rankings Report generated from TreeAge Pro. This can also be found in the Original Data & Results sheet of the workbook. It should be noted that when you first export the model to Excel the TreeAge Rankings report should match the results in the second table. At any time, you can compare the Current versus Original Excel Results versus Original TreeAge Pro Results in the Original Data & Results worksheet (see section below).
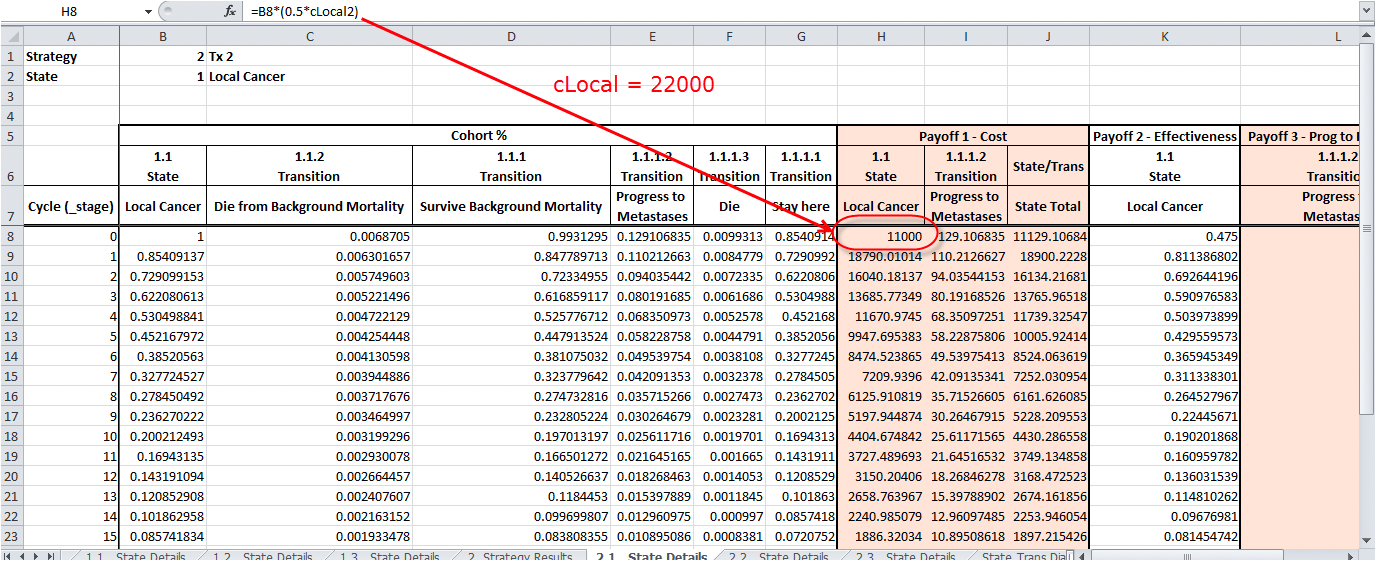
Below is a simple example of changing the model inputs in Excel to demonstrate how the model outputs change and how the Excel model is dynamic.
Example: Changing model inputs to impact model
This example is to show how changing model inputs recalculates the model results dynamically.
-
Before we change inputs, review worksheet 2.1 State Details, to see details about Strategy 2 (Tx2) and Health State 1 (Local Cancer). Note that in the Cycle 0 row in the column labeled Payoff 1 – Cost/1.1 State/Local Cancer, the calculated value for the cell is 11000, which is ½ of the cLocal2 parameter cost to account for half-cycle correction.
-
In the Inputs & Results sheet, review the current value: ICER = 32,653.
-
In the Inputs & Results sheet change the cLocal2 parameter value from 22000 to 24000.
-
Return to the sheet 2.1. State Details. Observe that the value in the same cell has changed from 11000 to 12000 (half the new cLocal2 value).
-
In the Inputs & Results sheet, review the current value: ICER = 46,652. (You could also review the cost of Tx2 which has also changed).
51.2.2 Strategy Calcs
The Strategy Calcs worksheets show the Markov Summary report for each treatment, i.e. Strategy 1 results on worksheet 1. Strategy Results. This is a summary of overall cohort flow among states and accumulation of outcomes by cycle. It does not contain details of how the cohort flows among events or how outcomes are accumulated at specific states and events. Those details are on the Strategy Details worksheets.
Note that if you choose to show strategy results on a single sheet, this sheet will also include all the calculations related to health states and events for the Markov process.
This section describes a conversion without that selection, so state/event details are in a separate section later in this section.
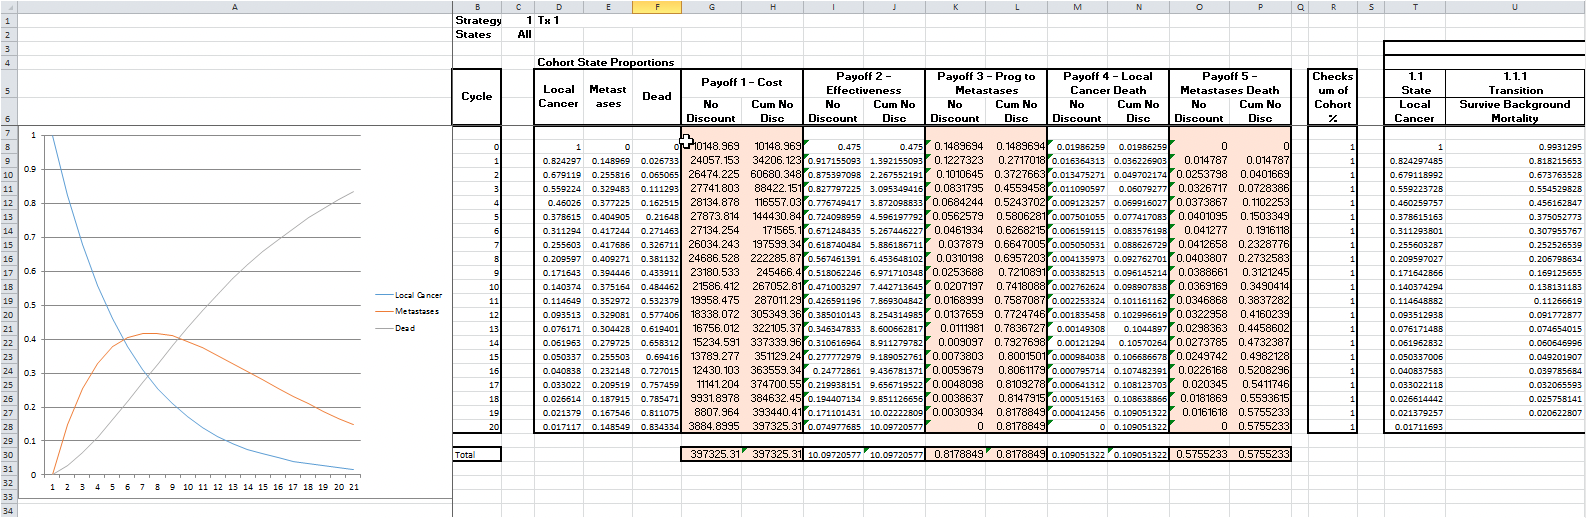
At the left of each sheet, before the results is a Markov Probability (state probability) graph. This is generated dynamically from the results in the Strategy Results worksheet.
The Strategy Results worksheet is broken down into three sections:
-
Cycle: Presents each cycle in the model as the _stage keyword increments.
-
Cohort State Proportions: Presents the proportion of the cohort that starts each cycle in each health state.
-
Payoffs: Presents the total value of each model outcome (enabled payoff) accumulated during each cycle
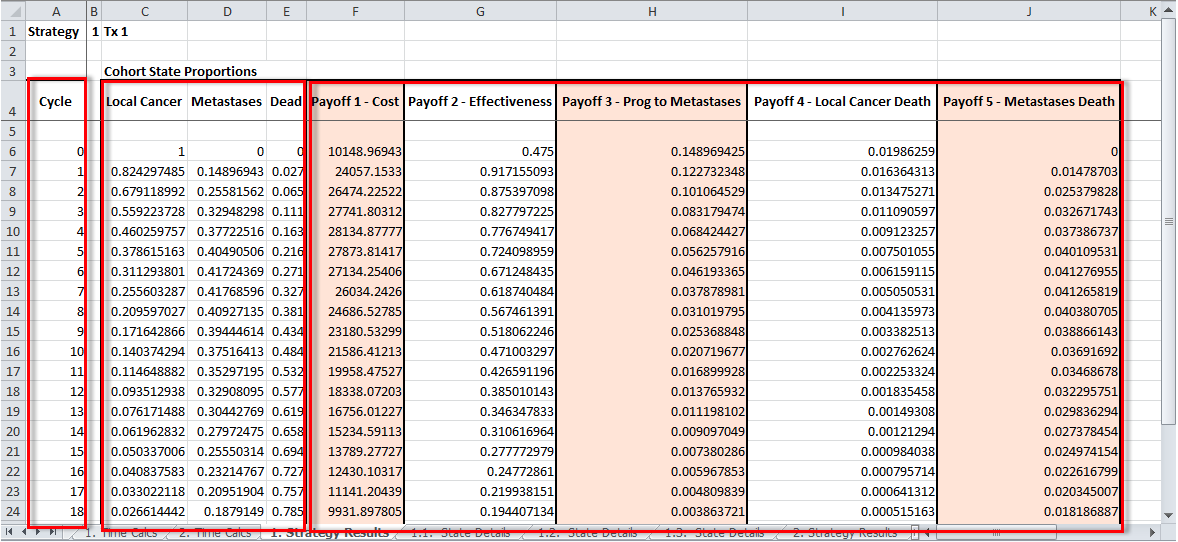
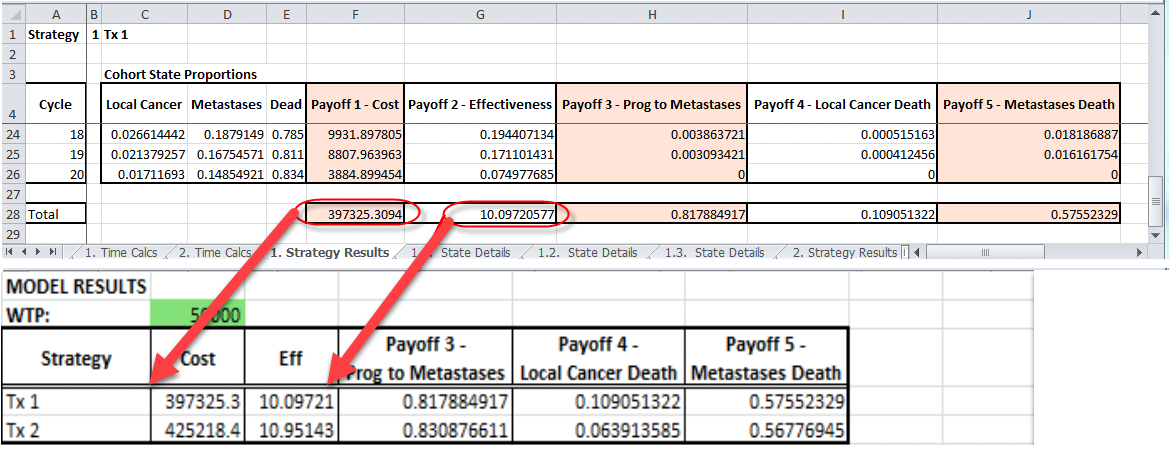
The totals for each outcome/payoff at the end of the time horizon are given at the bottom of each payoff column, providing the cumulative value for each payoff. These cumulative values are the total expected values for each outcome, and they are presented again in the Inputs & Results worksheet.
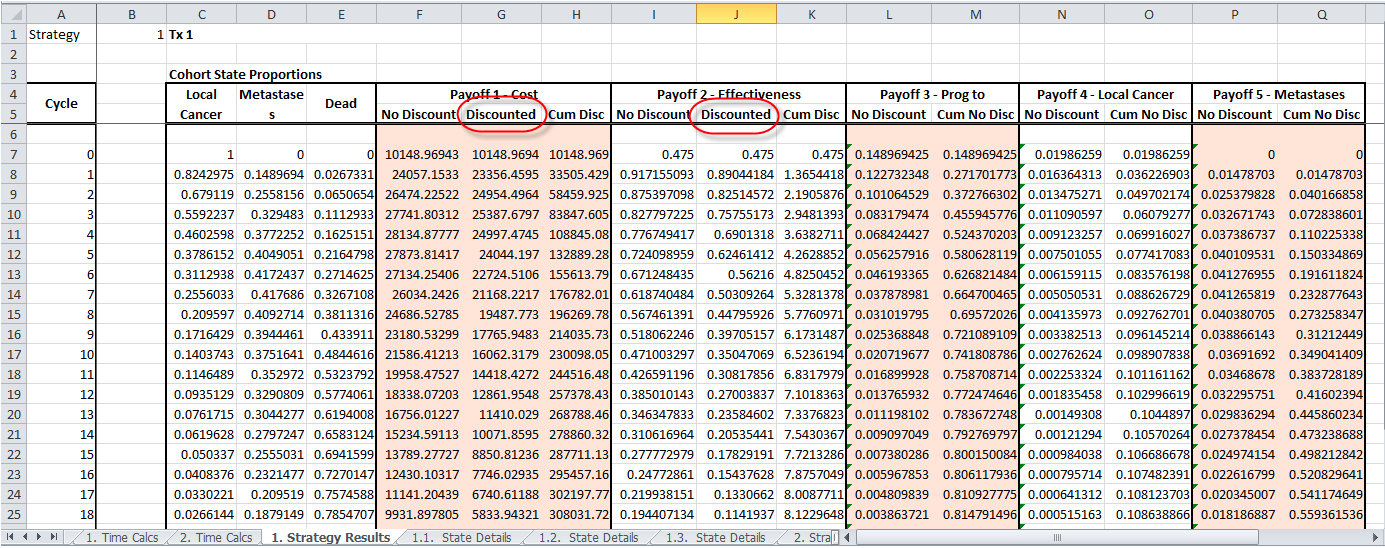
If Global Discounting is turned on in the Markov model, there will be an additional worksheet called Global Discounting. The Strategy Results worksheet will have additional columns stating if the payoffs have been discounted or not. The figure below shows the additional details included in the worksheet and more details can be found in the Discounting in Excel models section of this chapter.
Validating the Strategy Results
To validate the Excel Strategy results with TreeAge Pro:
-
Select a strategy to validate, for example choose the first strategy, Tx 1.
-
In TreeAge Pro, select the Strategy 1 Markov node.
-
Choose Analysis > Markov Cohort > Basic Report from the TreeAge Pro menu (see Markov Reports for more details). You should see the same accumulation of outcomes by cycle in the Summary lines within the report.
-
For output even closer to the Excel strategy summary output, click on the Summary Report link to the right of the Markov Basic Report output.
The Summary report can be directly compared to the worksheet 1. Strategy Report. The TreeAge Pro report uses _stage as the column heading compared to cycle in the Excel worksheet. The meaning is the same. The payoff columns are equivalent between the reports, noting that the Summary report maintains a cumulative totals column for each payoff too.
For example, compare the Cost and Effectiveness in cycle (_stage) 9 and observe:
-
Cost: 23180 (to 0 decimal places)
-
Effectiveness : 0.52 (to 2 decimal places)
To change the number of decimal places in the TreeAge Reports see how to change the Numeric Formatting. This will give you a comparison with the same decimal points.
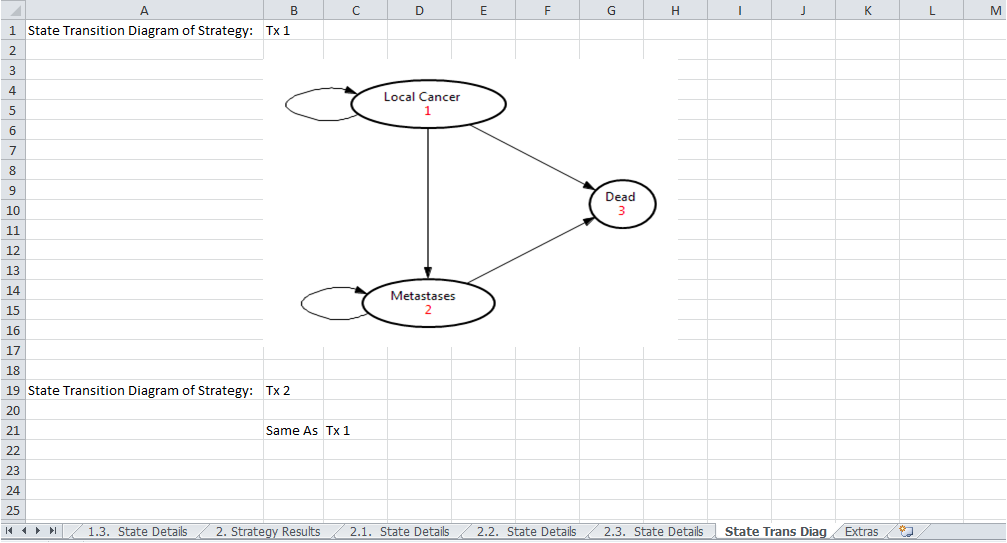
51.2.3 State Transition Diagram
This provides the equivalent State Transition Diagram for the Markov models which have been converted. Note that this is a simpler “bubble diagram” presentation of patient flows within the Markov model.
If the model contains clone masters and copies, the worksheet will just display a State Transition Diagram for the clone master.
51.2.4 Input Tables
Any tables in the model will be presented within this worksheet, with the details of the TreeAge Pro table name above the data. In this model there is only one table hence only one table worksheet.
In any of the tables on the Input Tables sheet, you can edit the table values highlighted in green. We recommend against editing the table index entries highlighted in red as this could impact formulas within the Excel workbook.
In this example model, the table is interpolated between rows to calculate the missing values of Death from Background Mortality for missing ages. In the Excel workbook, there is a macro which re-creates the same interpolation.
Please note table lookups in Excel require macros to be enabled.
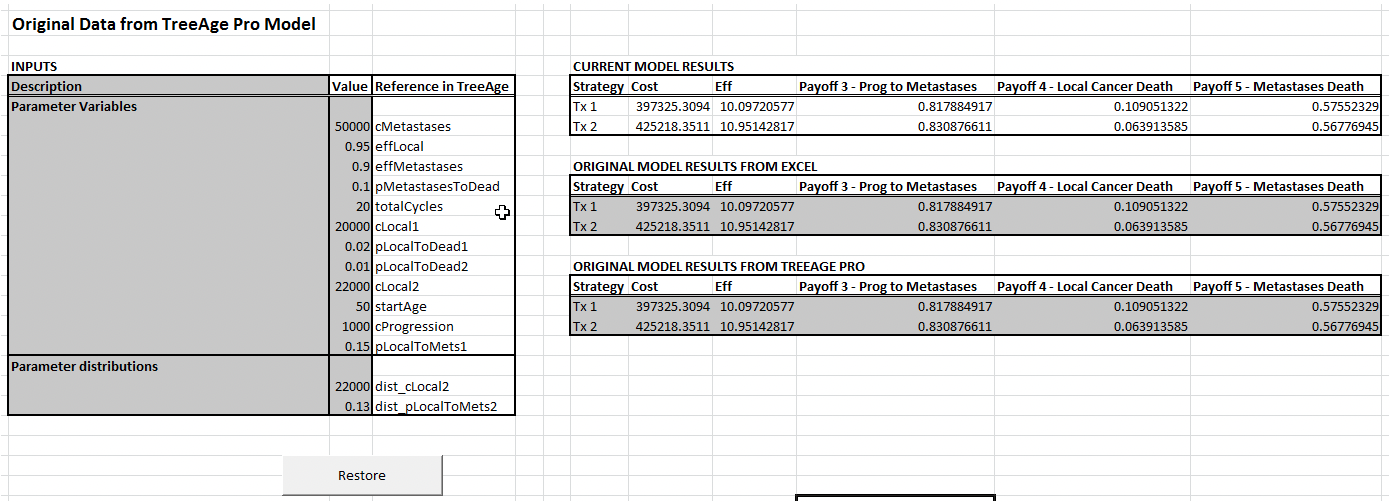
51.2.5 Original Data & Results
The Original Data & Results worksheet provides:
-
The original model inputs from TreeAge Pro when the model was converted.
-
Current Model Results based on the inputs within the Inputs & Results spreadsheet. These will change as the Excel model inputs are changed.
-
Original Model Results from Excel, giving the values when the model was converted.
-
Original Model Results from TreeAge, giving the results as calculated in TreeAge when the model was calculated.
-
Restore: This will restore the original values (as in the Inputs table) to the Excel model, resetting the original model values.
The results from the Original Model Results tables should match when the model is converted and they should not change as the inputs are updated.
51.2.6 State Details
The State Details worksheets presents additional cohort analysis details to provide complete transparency of all calculations in the analysis. This report shows a complete cohort trace through every health state and event in every cycle.
Each worksheet name is of the format: X.Y State Details. This indicates X is the Strategy number and Y is the Health State. In our example model we have six State Details worksheets for the combination of 2 strategies and 3 health states. The Health States are numbered based on their order from top to bottom from the Markov node.
The Strategy Details worksheet is broken down into three sections:
-
Cycle: Presents each cycle in the model as the _stage keyword increments.
-
Cohort State/Event Proportions: Presents the proportion of the cohort that passes through each node. For each health state, this is the cohort percentage that starts each cycle in that health state. For transition subtree events, that is the cohort percentage that passes through the event node.
-
Payoffs: Presents the total value of each model outcome (enabled payoff) accumulated during each cycle broken down by its source node – health states and/or transitions.
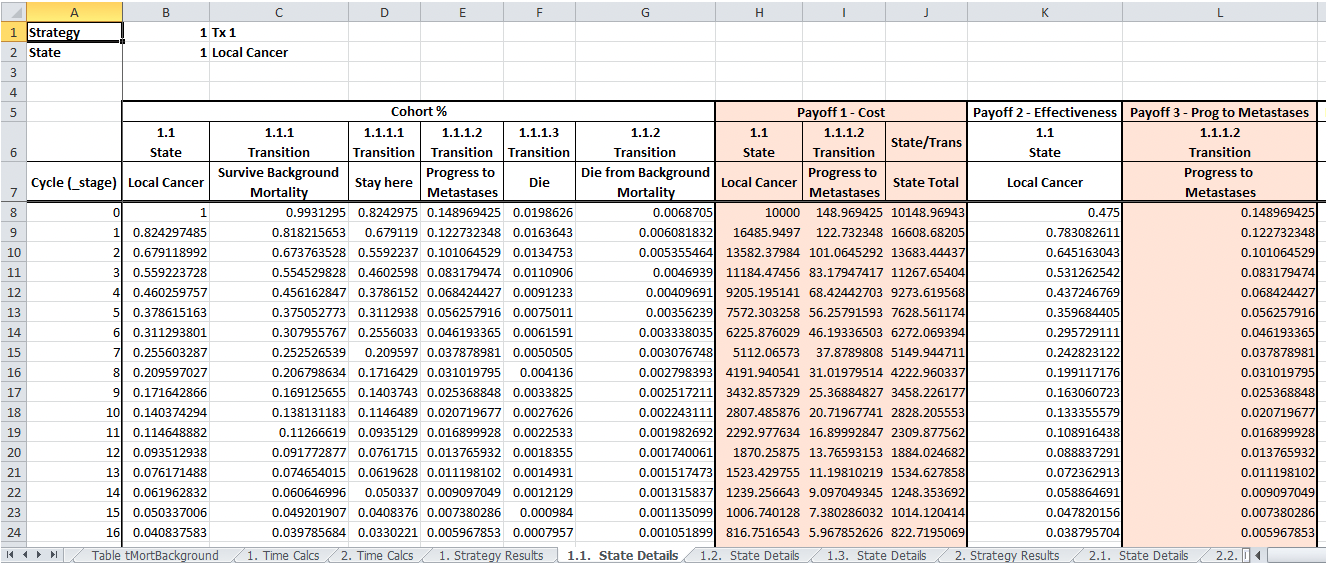
The rest of this section will look validation and explanation of the reports and will focus on Strategy 1 (Tx1) considering the first Health States (Local Cancer).
Validating the State Details Report
In this example model, there are three health states. Details from each are represented by a different worksheet:
-
1.1 State Details: Strategy 1 and Local Cancer
-
1.2 State Details: Strategy 1 and Metastases
-
1.3 State Details: Strategy 1 and Dead
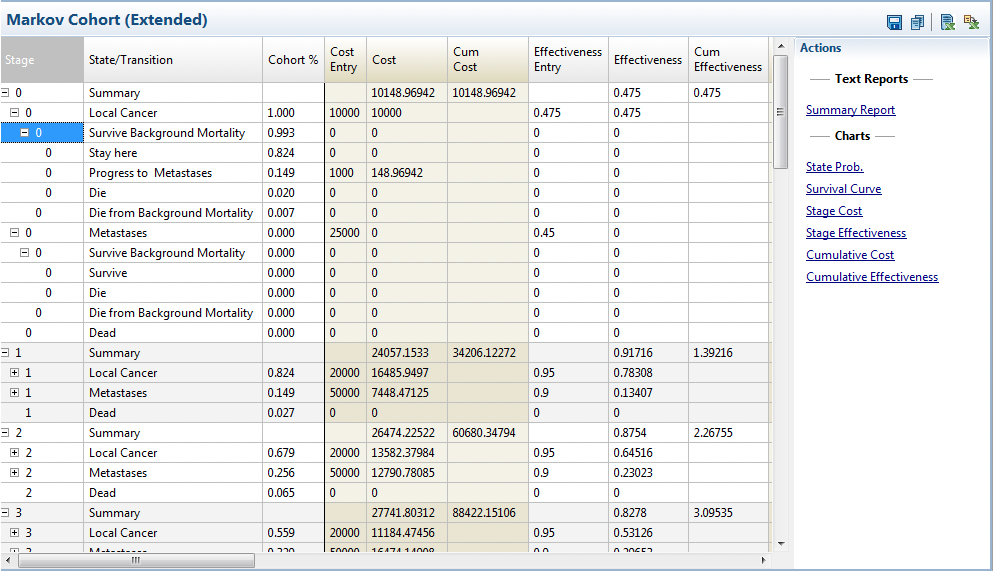
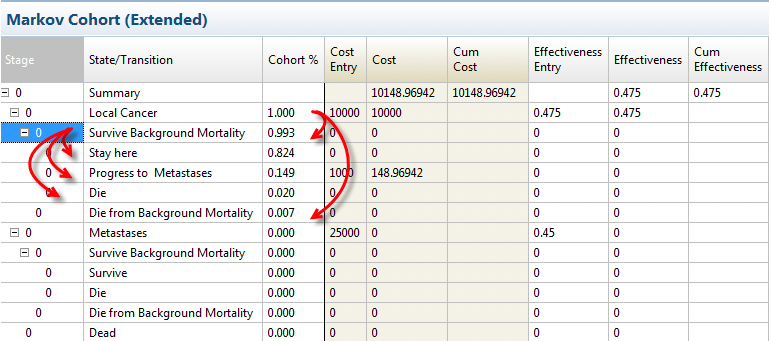
All the details from these worksheets can be found in TreeAge Pro on the Markov Extended Report, which can be generated as follows:
-
In TreeAge Pro, select the Strategy 1 Markov node (Tx1).
-
Choose Analysis > Markov Cohort > Extended Report from the TreeAge Pro menu. The Extended report is a detailed version of the Markov Basic Report. You should see the same accumulation of outcomes by cycle in the Summary lines within the report
-
Using the ‘+’ expansion buttons in the Stage column of the Extended report, expand out the rows in the first cycles to see the details of the cohort movement between the Health States and Transitions. The cohort movement is described in detail in Markov Reports.
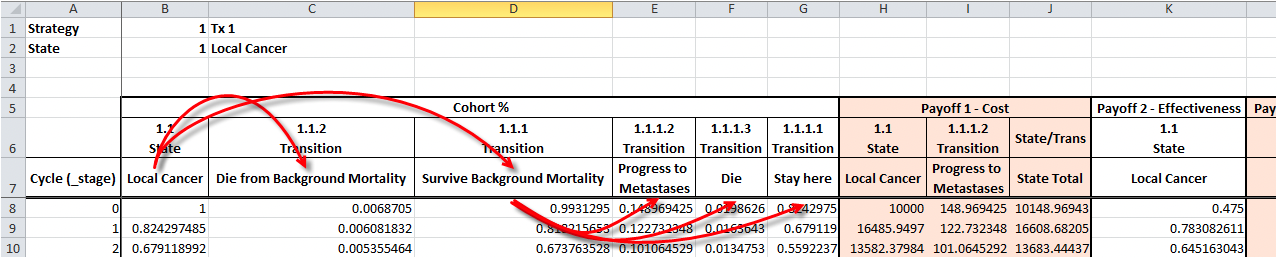
Compare the 1.1 State Details worksheet to Markov Extended Report. The transitions in the Local Cancer State are detailed in the Cohort % columns in the 1.1 State Details worksheet. The same cohort movement is shown in rows on the Markov Extended report (see the figure below). The figures will be described in more detail to show how to validate both the reports.
First, examine the information in the 1.1 State Details worksheet. The column headings describe the following:
-
1.1 is the Local Cancer state. Any transition from this state will start with 1.1.X
-
1.1.1 Survive Background Mortality. Any transitions from Survive Background mortality will start 1.1.1.X
-
1.1.1.1 Stay here, i.e. remain in Local Cancer
-
1.1.1.2 Progress to Metastases, i.e. transition to Metastases
-
1.1.1.3 Die, i.e. transition to Dead
-
-
1.1.2 Die from Background Mortality. There are no transitions from Die from Background Mortality.
-
The Extended Markov Report has the advantage that all Health States and Transitions are displayed on one report. For example, in _stage 0 the report shows the proportion of the cohort who starts in each of the Health States (Local Cancer, Metastases and Dead) and then, of those who start in a Health State, where they transition to, shown by the rows directly below each health state.
In the State Details worksheet for Local Cancer (1.1 State Details) consider the cohort in cycle (_stage) 0. The movement of the cohort is as follows (to 3 decimal places):
-
Start in Local Cancer: 1.0
-
Survive background mortality: 0.993
-
Die from background mortality: 0.007
-
-
Of those who survive background mortality (0.993):
-
Stay here: 0.824
-
Progress to metastases: 0.149
-
Die: 0.020
-
Based on the proportion of the cohort in each state and transition, payoffs are accumulated.
For example, in Local Cancer in _stage (cycle) 0, there are two contributions to Cost (half-cycle corrected):
-
Local Cancer (State Reward): 1.000 * cLocal1 *0.5= 1.000 * 20000 * 0.5 = 10000
-
Progress to Metastases (Transition Reward): 0.149 * cProgression = 0.149 * 1000 = 148.969
-
State Cost total = 10000 + 148.969 = 10148.969
These calculations can be seen as formula within the cells in the 1.1 State Details worksheet by selecting any cell.
In this given example of 1.1 State Details report, the State/Trans column provides the total payoffs for the cycle if the payoff total is derived from state and transition components (in the case of Cost). In the case of payoffs such as Progress to Metastases, there is only one source so only one column.
If your model has tunnels, refer to the section Tunnels in Markov Excel models for more details about interpreting the Excel worksheets associated with tunnel states.
If your model uses the Within-Cycle Correction method, refer to the section Within-Cycle Correction in Excel models for details about validating the Excel workbook with TreeAge Pro.
51.2.7 State details - Single Sheet per Strategy
In the two previous sections, the Strategy Calcs and State Details worksheets presented Markov calculation data on separate worksheets by default. You can instead choose to combine the strategy results in a single worksheet by choosing the conversion option "Single Sheet per Strategy". For this model, the results are then presented in two worksheets, one for each strategy.
The first section of the Single Sheet Strategy results show the Markov Summary report for each strategy. This is a summary of overall cohort flow among states and accumulation of outcomes by cycle. It does not contain details of how the cohort flows among events or how outcomes are accumulated at specific states and events. Those details are then provided in further columns to the right-hand side. Details about these results can be found in the above sections: Strategy Calcs and State Details.
51.2.8 Time Calcs
The Time Calcs worksheet displays any values included in the model which change by cycle for each Strategy. In our model, two values are dependent on the cycle (_stage):
-
age: a function of the start_Age and _stage; and
-
pDeathBackground: the probability of death from background mortality which is drawn from a table referenced by age. Again, age is a function of _stage.
Any value in the model which references _stage (time dependent) would also be displayed in the same worksheet in a separate column.
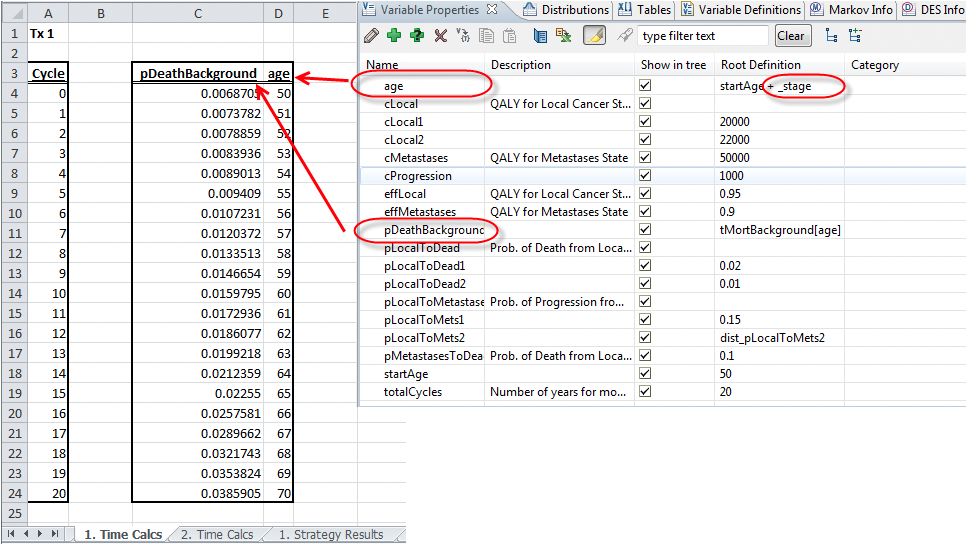
There is only one Excel worksheet for both strategies and the table will list the Strategy name above the table related to each strategy.
51.2.9 Time Discounting
When Global Discounting is turned on in the model's Tree Preferences, an extra worksheet named Time Discounting will be included in the Excel model. The Global Discounting worksheet shows the discount factor applied to each reward set by cycle (_stage).
The Health Care Tutorial Example, Markov Conversion Model Discounting.trex is the same as the previous example model, except with discounting on for payoff sets 1 and 2. When you convert that model, you will see the following in the Global Discounting worksheet, reflecting an interest rate of 3%.
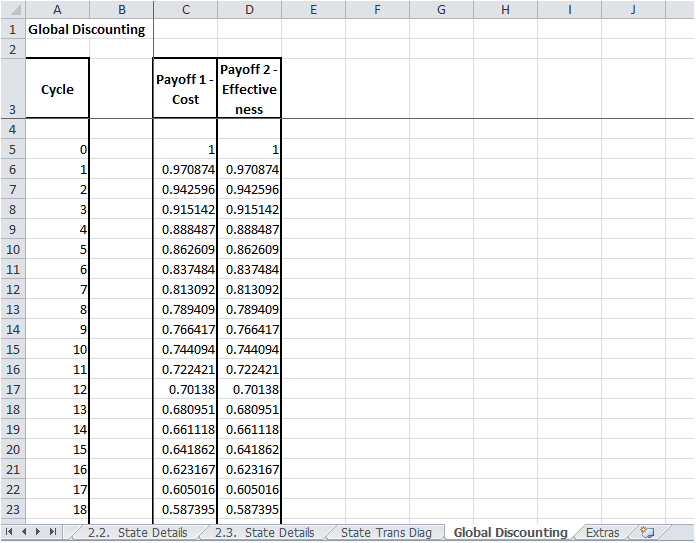
The discount factor is used to multiply its corresponding payoff in the Strategy Calcs worksheets to give the discounted value of the payoff per cycle.
Refer to the Discounting in Excel models section for more details.
