28.5 Graph Axis Controls
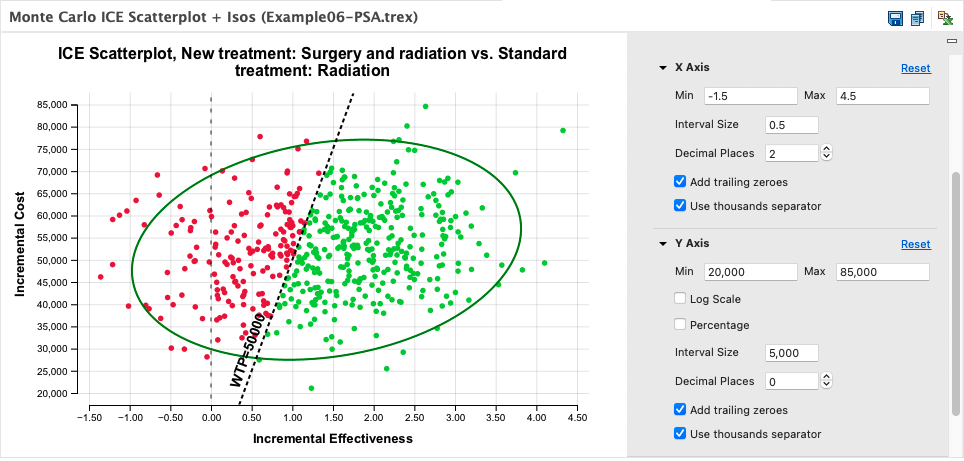
All graphs include controls for the x-axis and y-axis. These controls include range (min to max), interval size and numeric formatting.

Y-axis options include controls to show values on a log scale (typically for survival graphs) and as percentages (for probabilities).
28.5.1 Rescaling X-Axis Time/Cycle Values
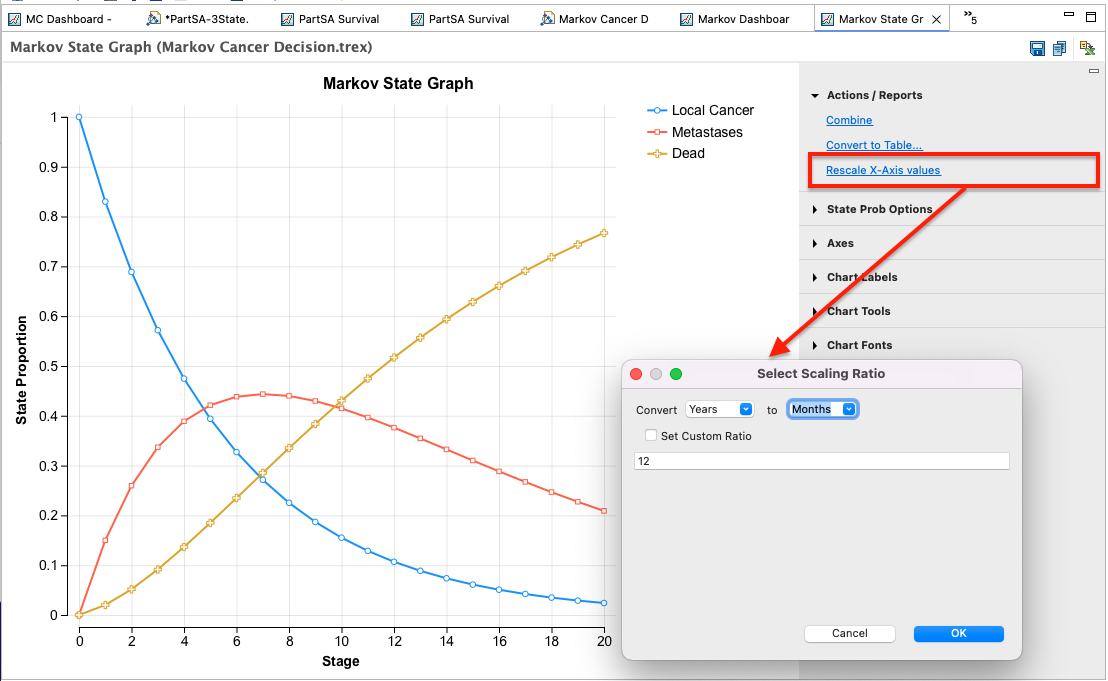
In some graphs, the x-axis represents the passage of time - cycle/stage in Markov models or time in Partitioned Survival and Discrete Event Simulation models. When the x-axis represents time, there is a control to rescale the time (i.e., from annual to monthly). In the following Markov State Graph, the stage is annual and the graph below shows 20 annual cycles. To show the x-axis as a different scale, using the Rescaling X-axis values option.

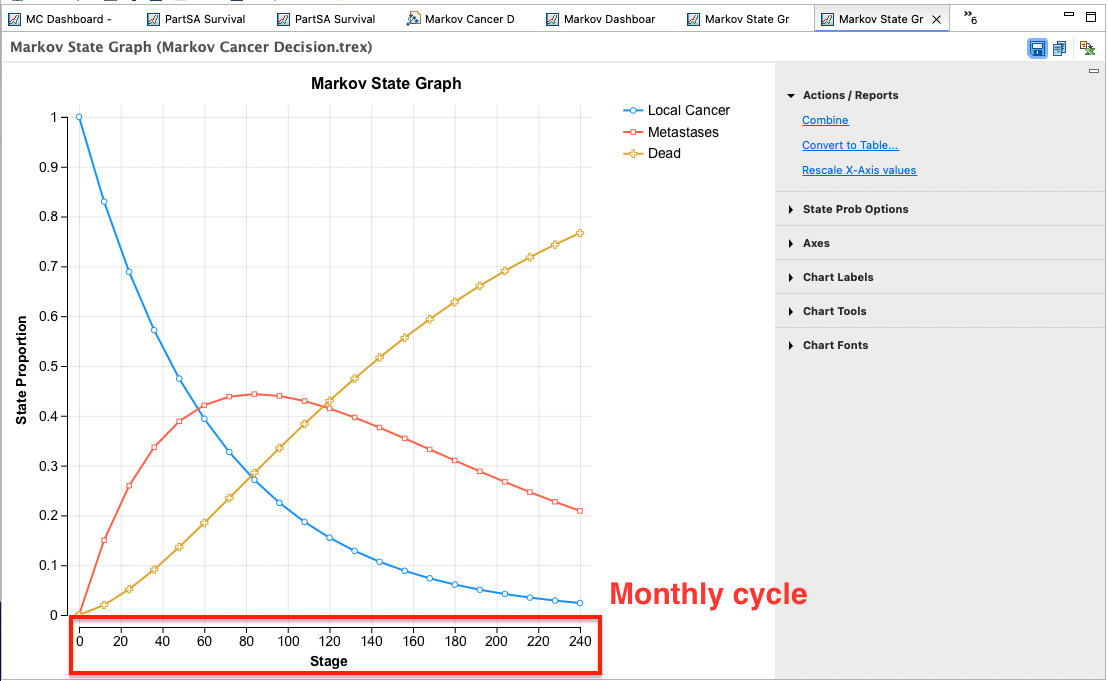
The resulting graph is essentially the same, but the x-axis is converted to a new time unit.

This option is available for several graphs.
-
Markov models: State Graphs and Survival Curves
-
Partitioned Survival models: Survival Curves and Hazard Curves
-
Discrete Event models: Patient Tracking State Graphs
