34.2 Markov Cohort Analysis Output
Markov Cohort Analysis provides several layers of details related to Markov model analysis - including disease progression and the accumulation of values at each state and event during each cycle. These reports are critical to validating your Markov model accurately represents the disease process.
We will use the Health care tutorial example model Markov Cancer Decision.trex to examine this output - focusing on the top strategy Tx 1.
To run the Markov Cohort Analysis:
-
Select the Tx 1 Markov node.
-
Choose Analysis > Markov Cohort from the menu (or click the toolbar icon in the Analysis Layout).
The Markov Cohort Dashboard provides a graph representing disease progression among the states. It also provides access to a series of detailed graphs and reports related to the cohort analysis.
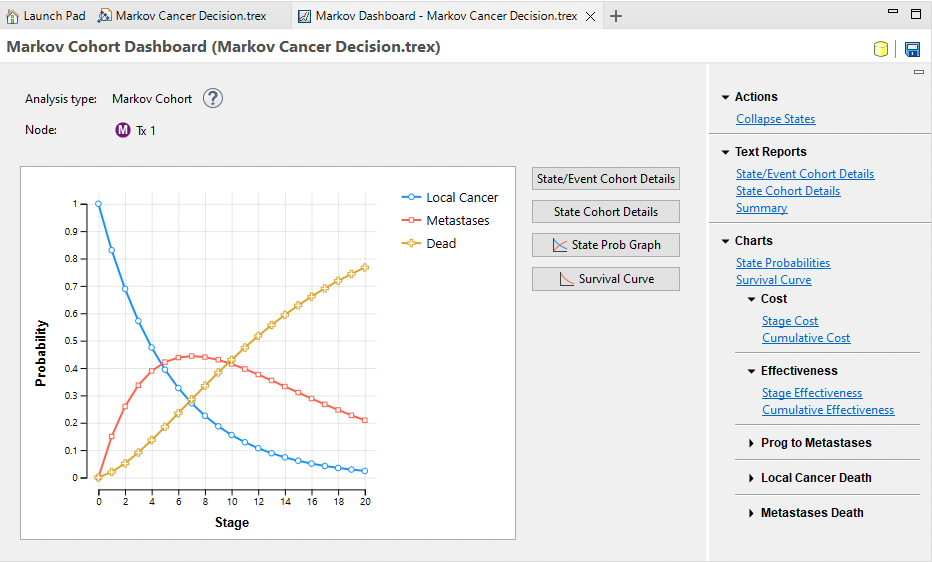
Reports and graphs links to the right provide additional details about the Markov cohort analysis calculations.
34.2.1 Markov State/Event Cohort Details (Extended Report)
Click the link Text Reports > State/Event Cohort Details to open the Markov Cohort Extended Report. This report provides the most visibility into the internal calculations executed during Markov Cohort Analysis.
This report provides a detailed text report showing the movement of the cohort through each state node and transition node as well the accumulation of rewards at each node.
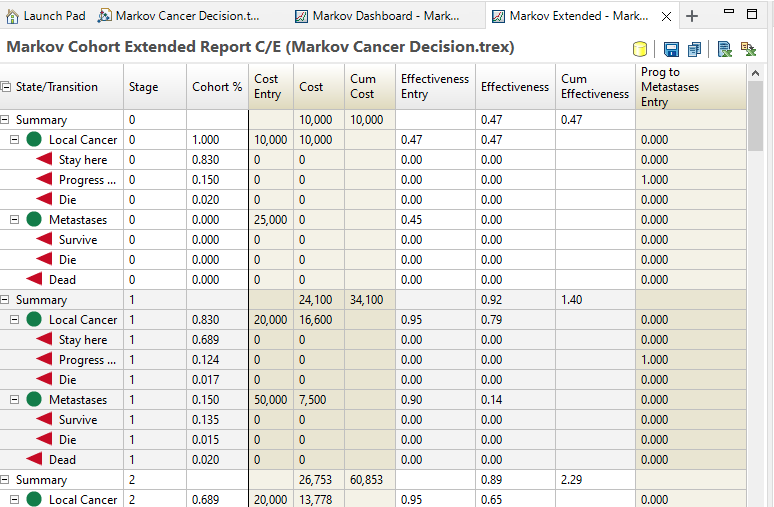
The report contains multiple groupings by row for different levels of the model. Each grouping can be expanded or collapsed individually at each row using the '+' icon. Additionally, expanding/collapsing all rows to just the state level rows can be done via the '+' in the State/Transition column heading.
There is a summary row for each cycle reflecting the total values accumulated in each cycle. Within the cycle grouping, you can expand to the health states and individual events within each state's transition subtree.
The first three columns in the report show the movement of the cohort through the states and transitions.
-
State/Transition: The Markov state or event node within the transition subtree.
-
Stage: The _stage (cycle) counter starting with zero.
-
Cohort %: The percentage of the cohort passing through that node during that cycle. For a state, it is the percentage of the cohort starting the cycle in that state. For an event, it is the percentage of the cohort that experience that event node during that cycle.
The next columns in the report will refer to specific reward sets. A separate column grouping will be presented with different shading for each calculated reward set.
-
Cost Entry: The calculated value of the cost expression entered at that node, whether it is a state (state reward) or an event (transition reward). This allows you to check the calculations of your cost entry formulas without the cohort percentage yet applied. In this model, the calculated value of the rewards are just simple references to parameter variables. Those variable definitions are calculated.
-
Cost: The accumulated reward value based on the reward entry described above multiplied by the percentage of the cohort that passed through that node. By weighting the cost by the cohort %, it becomes part of the weighted-average calculation to get the overall cost EV for the entire Markov process. In the Summary row, the Cost value is the total reward accumulated by all nodes for that cycle.
-
Cum Cost: The cumulative reward for all cycles from _stage 0 through this stage.
Note that for every enabled payoff set, the same three columns show the accumulation of values for that model outcome. The Markov Cancer Decision.trex model has another primary payoff for Effectiveness since it is a cost-effectiveness model as well as 3 additional enabled payoffs.
Let's review some of the calculations.
-
At _stage 0, the cohort all starts in the Local Cancer state based on the initial probabilities.
-
0.150 of the cohort move to the Progress event and 0.020 of the cohort move to the Die event based on the event probabilities in the model. Those percentages then move to the Metastases and Dead states for the beginning of _stage 1.
-
At the Local Cancer node in _stage 0, the whole cohort is at that state, so the full 10,000 cost entry is added to the accumulated cost.
-
At the Local Cancer node in _stage 1, the accumulated cost is the product of the cohort % at that node and the cost entry - 0.83 * 20,000 = 16,600 - which is added to the accumulated cost. The same cohort % weighting is applied to every health state and event with a value.
-
The summary line presents the total cycle value from all states and events. For _stage 1, cost is accumulated from both the Local Cancer and Metastases states - 16,600 + 7,500 = 24,100.
If we scroll to the bottom of the report, we see the Summary for the full Markov model.
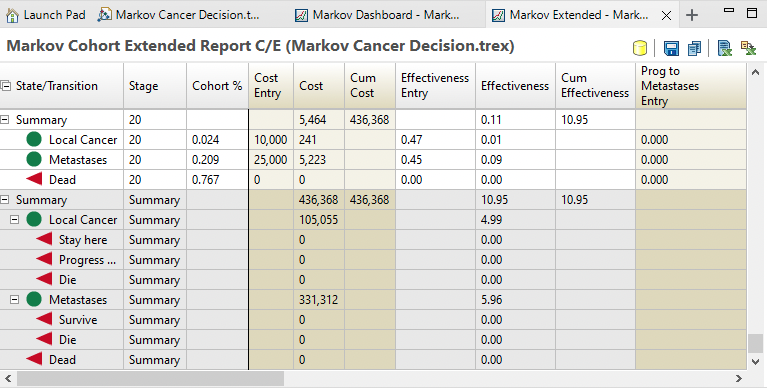
The Summary grouping presents the full values of all payoffs accumulated at every state and event in the model. In this example, the expected value for cost is 436,368, comprised of 105,055 from the Local Cancer state and 331,312 from the Metastases state. No other states/events contribute to cost. This overall cost EV would be used in decision analysis to compare with other strategies. Note that summary EVs are calculated for every enabled payoff.
If global discounting is applied, the Markov Extended report includes extra columns to see the impact of discounting. The figure below shows the same cohort report with a 3% annual discount rate applied.
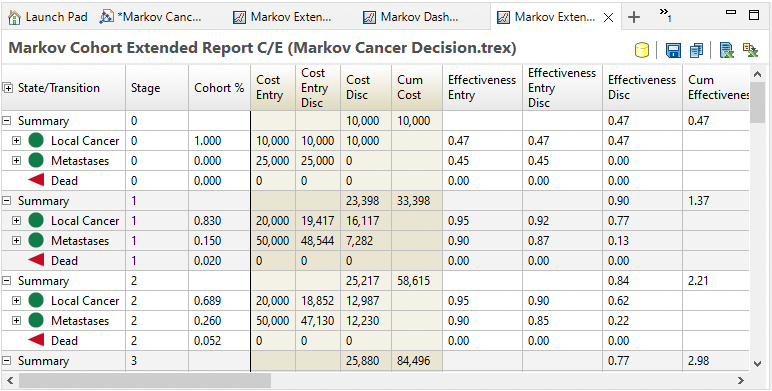
Note the extra column for the Cost Entry Discounted (and for Effectiveness since it is also discounted). This column represents the discounted value for the cost entry based on time elapsed. At _stage 0, there is no impact, but at _stage 1, the discounted value of 20,000 is 19,417. The discounted value is then applied to the cohort % - 19,417 * 0.83 = 16,11 - so that discounted values are accumulated in the model.
34.2.2 Markov State Cohort Details (Basic Report)
Click the link Text Reports > State Cohort Details to open the Markov Cohort Basic Report. This report is similar to the Extended report except that only Health States are shown but no Events which creates a shorter/consolidated report.
This report provides a detailed text report showing the movement of the cohort through each state node and the accumulation of rewards at each node.
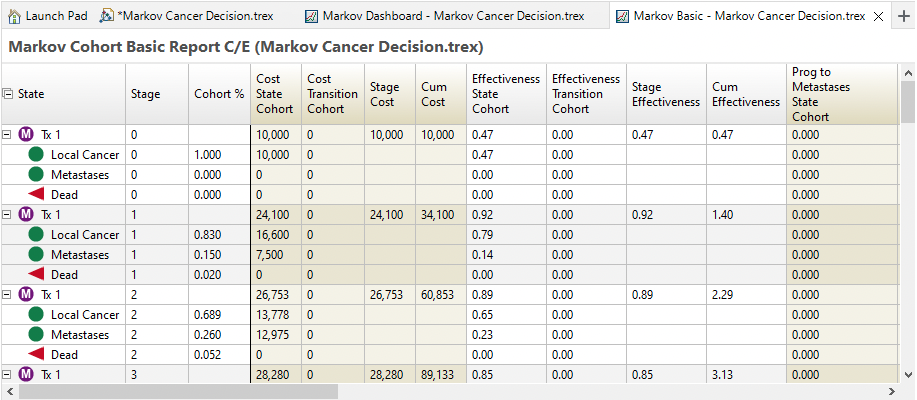
There are rows for each state, but they cannot be expanded to see the subsequent events. Any values accumulated at the event nodes are placed in the "Transition Cohort" columns of the report for each payoff.
The report columns are:
-
State: The model health state.
-
Stage: The current cycle.
-
Cohort %: The percentage of the cohort starting that cycle in that state.
-
Cost State Cohort: The accumulated cost at the state node, which is the calculated value of the reward entry expression multiplied by the percentage of the cohort starting the cycle in that state.
-
Cost Transition Cohort: The accumulated cost at every event to the right of that state node, which is the sum of the calculated value of the reward entry expression at each transition node multiplied by the percentage of the cohort that passes through that event in the cycle.
-
Stage Cost: The reward accumulated for all nodes (states and events) within that stage.
-
Cum Cost: The cumulative reward for all cycles from _stage 0 through this stage.
The four cost columns above would be repeated for any additional payoffs/outcomes in the model.
It is often sufficient to use the Basic Report for reviewing Markov Cohort Analysis output, but additional details and transparency is available in the Extended Report.
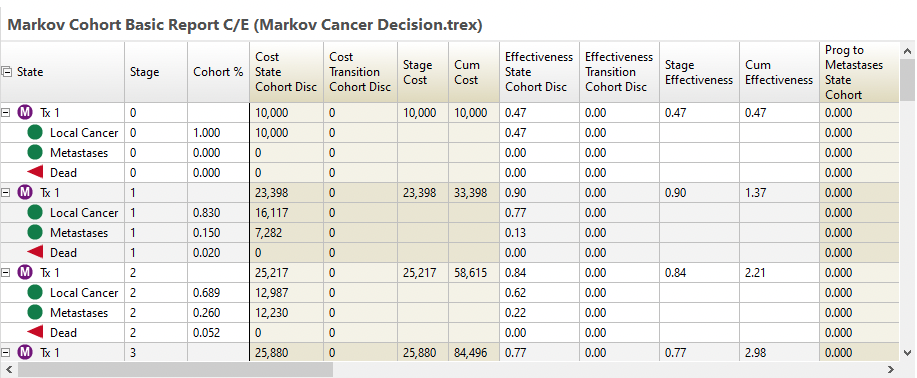
With discounting on, all the cost/reward columns would display discounted values. The figure below shows the same output with an applied 3% annual discount rate.
With the Markov 3 State - Traditional model using a 3% Annual Discount rate, the Basic Markov report is generated, as below.
34.2.3 Markov Cohort Reports & Within-Cycle Correction
Within-Cycle Correction (WCC) uses a slightly different algorithm for Markov Cohort Analysis with respect to accumulating values with time during a Markov cycle.
-
In Traditional models, state rewards are applied for an entire cycle based on the cohort percentage in that state at the start of the cycle.
-
In WCC models, cycle rewards are applied for a cycle based on the cohort percentage in that state at both the start and the end of the cycle.
This Markov Cohort Extended and Basic Reports present the data in a slightly different way to show WCC applied. The reports below were generated from the Healthcare tutorial examples Markov Cancer Decsion-WCC.trex.
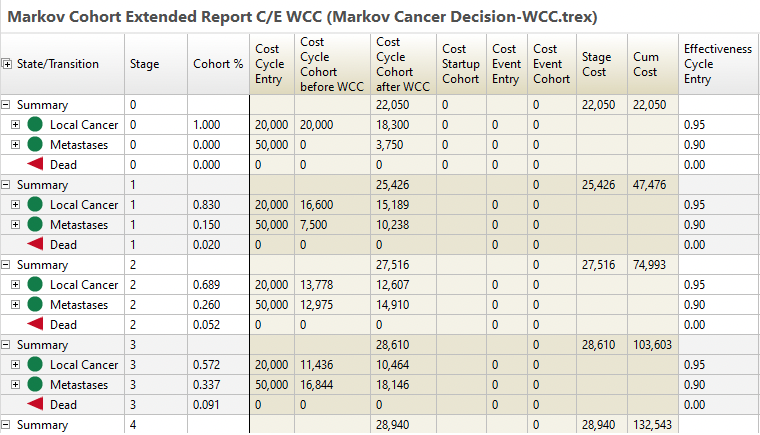
The WCC report's State/Transition, Stage and Cohort % columns function the same as the traditional reports. The WCC reports differ from the traditional reports in the value columns, with the cost columns shown above.
-
Cost Cycle Entry: The calculated value of the cycle reward expression entered at that node. This is the same as the traditional report.
-
Cost Cycle Cohort before WCC: The pre-WCC cycle reward value based on the Rwd Cycle Entry described above multiplied by the percentage of the cohort that passed through that node. This is the value that would be used directly in a traditional model/report.
-
Cost Cycle Cohort after WCC: This is the value accumulated for the cycle reflecting the WCC calculation algorithm. It is calculated as the average of the cohort cycle cost calculated at the beginning of the current cycle and the beginning of the next cycle. In the Summary row, this column contains the total cycle rewards accumulated by all states for that stage.
-
Cost Startup Cohort: The value of the Startup Rwd for that state or for the entire cycle. Note that startup rewards are only accumulated in the first cycle (_stage = 0). The cohort % is already applied to this column.
-
Cost Event Entry: The calculated value of the event reward expression entered at that node before the cohort % is applied. Event entries are more likely to be used at events in the transition subtrees, but they can be applied at states as well.
-
Cost Event Cohort: The accumulated event reward value based on the Rwd Event Entry described above multiplied by the percentage of the cohort starting the cycle in that state.
-
Stage Cost: The total rewards accumulated for the entire cycle, including cycle, startup and event rewards.
-
Cum Cost: The cumulative stage rewards for all cycles from _stage 0 through this stage.
The columns above are repeated for every payoff/outcome.
The Markov Cohort Basic Report is also affected by WCC.
The Basic Report shows a more consolidated set of results by state just like traditional models, but there is an additional column to show the state-level values before and after WCC.
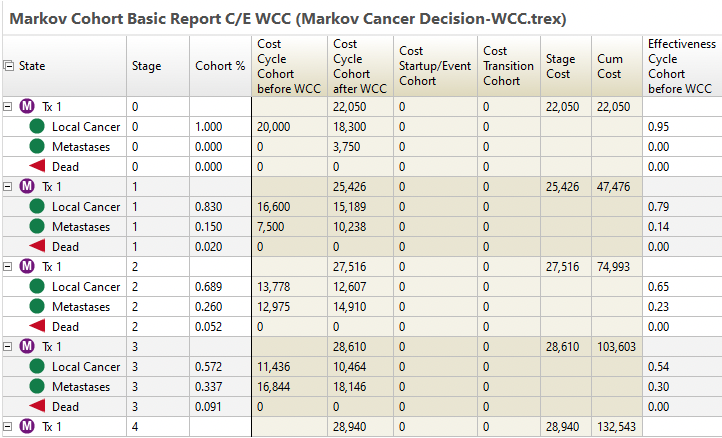
Discounting is applied in a similar way for both WCC and traditional models.
You can convert your model between Traditional (HCC) models and WCC using the Tree Preferences. The section Converting between Within-Cycle Correction and Half-Cycle Correction shows how to do this.
34.2.4 Markov Cohort Summary Report
The Markov Cohort Summary Report is a non-grouped 2-dimensional grid format for its output.
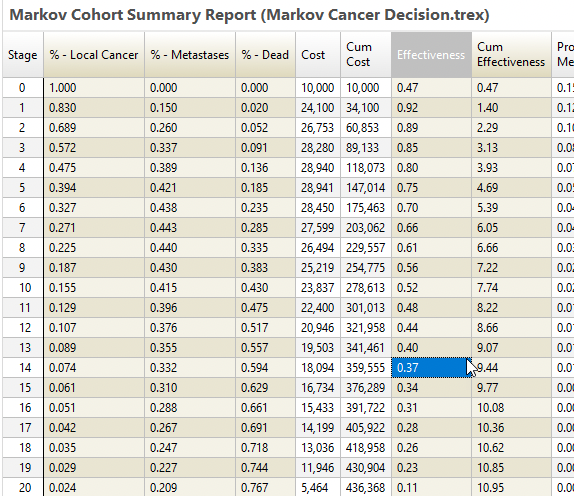
With no grouping and a standard grid format, this output is often better for exporting to Excel.
34.2.5 State Graph, Survival Curve and Other Graphs
You can also generate graphical data from the Markov Cohort Analysis output by clicking on the links to the right of the output data. Each option generates a graph tracking calculated values against time (stage). The options are described below:
-
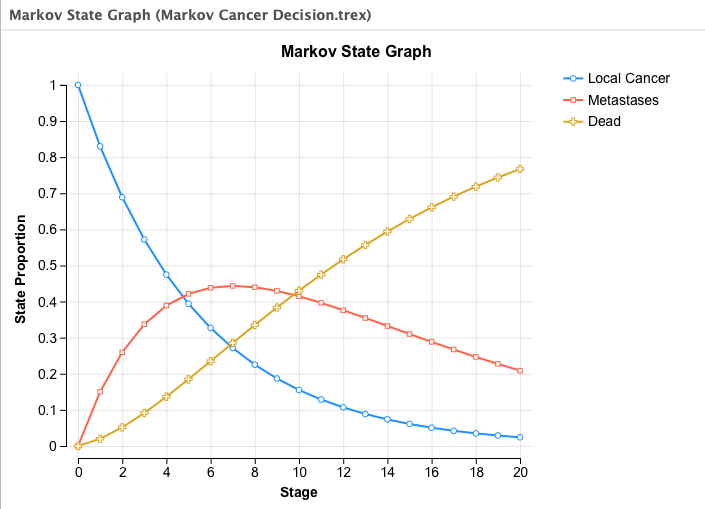
State probabilities: This graph plots the changing state probabilities at each cycle.
-
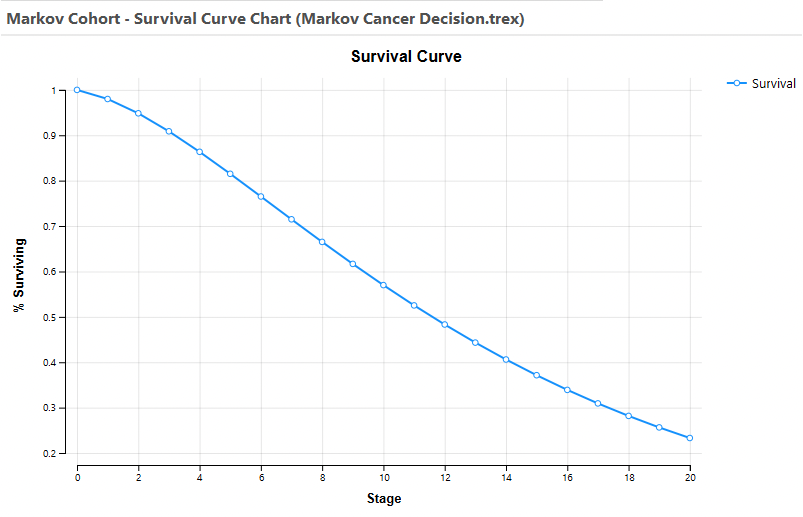
Survival curve: Survival curves are a standard means of communicating the results of a Markov analysis. TreeAge Pro will prompt you to select which states represent death, and then will plot the sum of the “alive” state probabilities. This graph can also be used to create probability curves that group other kinds of states — to plot disease-free survival, for example.
-
Stage cost: This graph shows the cost accumulated at each cycle. This graph is available for any payoff.
-
Cumulative cost: This graph shows the cumulative cost accumulated at each cycle. This graph is available for any payoff.
The Markov State Graph shows changing state membership over all model cycles. More details about editing the graph can be found in the section Graphs. Specifically, the x-axis can be easily edited to change the time unit, with details found in the Graph Axis Controls section.
The survival curve graph shows the percentage of the cohort that is alive (in any non-dead state) at the beginning of each cycle.
You can combine StateProb or Survival Curve graphs with the same graph type from another Strategy to see the overall results in one graph. In the Actions/Reports options to the right-hand side of either graph, there is the option to Combine. By selecting this, you can choose the other graphs (of the same type) to combine. More details are provided in the section Combining Graphs.
Options on editing graphs, from labels to axis and many other things are described in the Graphs chapter. It is possible to rescale the x-axis for a different time period as well.
34.2.6 Exporting Survival Data to a Table
Both the StateProb and Survival Curve graphs' data can be exported to a table for further evaluation and Calculating Hazards from Survival Data. This can be useful when assessing whether your model has applied appropriate risk of death and/or progression.
To generate a table from any series of a line graph:
-
Generate the graph.
-
Click the "Convert to table" link to the right of the graph under "Actions".
-
Select an open model to which the table will be added.
-
Enter the table name.
-
If there are more than one series in the graph, choose the series.
A new table will then be included in the selected model. It can then be assessed by Calculating Hazards from Survival Data.
