32.13 Probabilistic Sensitivity Analysis (PSA) on single outcome models
The previous sections have provided details about how Probabilistic Sensitivity Analysis (PSA) studies the impact of parameter uncertainty on model results. The sections have specifically considered the case of Cost Effectiveness models - looking at the example model Markov-PSA-Final.trex.
In a brief recap, PSA calculates a model many times with different sets of inputs. The varying input values are sampled from distributions that represent parameter uncertainty. We can then examine the set of results to assess the impact of combined uncertainty. A higher percentage of calculations that confirm your base case provides more confidence in your conclusions. This section will look at the same analysis but for single outcome models.
Example model - Single outcome model
We will use two example models which can be found in the Get Started example models folder:
-
Three Vars.trex prior to adding distributions
-
Stock Simulation.trex after adding the distributions
The "final" model is ready for PSA is pictures below.
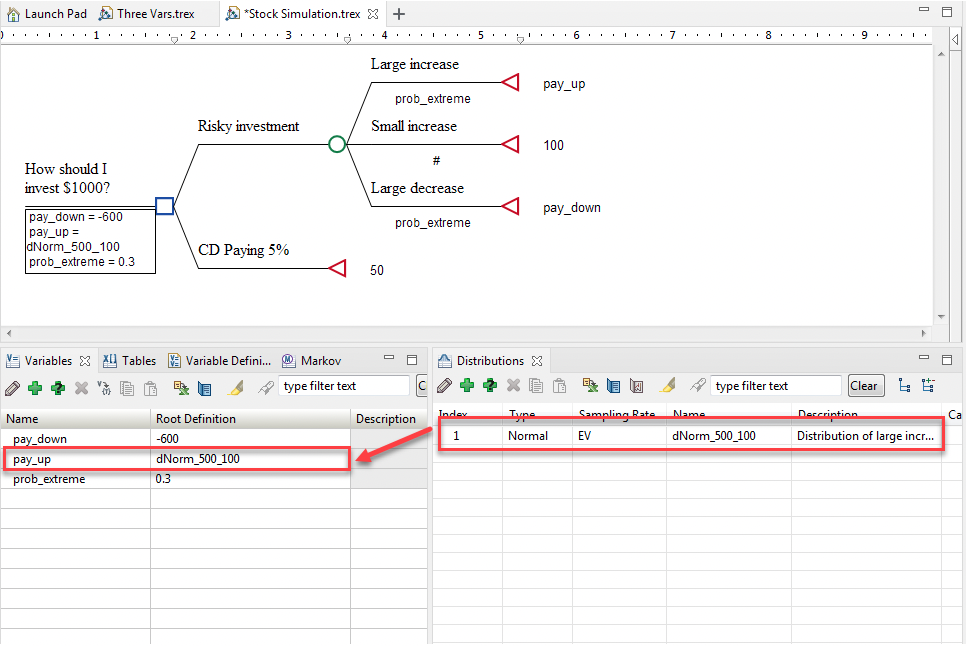
This model has distributions which have been added already and referenced in the Variables View.
Look at the section Creating and referencing distributions for more details.
Running Probabilistic Sensitivity Analysis (PSA)
PSA will run the model many times with each calculation using a different sample from our distribution. The set of model calculations is then used to generate a series of secondary outputs that help us better understand the impact of (combined) parameter uncertainty on our model.
-
Open example model Stock Simulation.trex.
-
Select the Decision node.
-
Choose Analysis > Monte Carlo Simulation > Sampling (Probabilistic Sensitivity)…from the menu. The Monte Carlos Simulation Dialog will open.
-
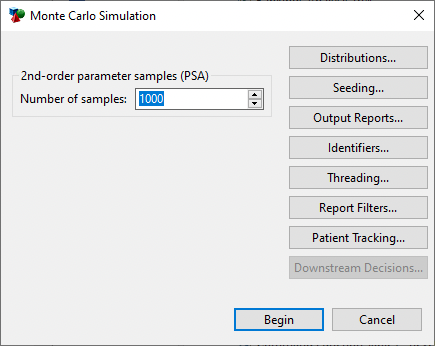
Enter 1000 for the number of samples to run (model calculations).
-
Click Begin to start the simulation.
When the analysis finishes, you will be presented with the PSA Dashboard.
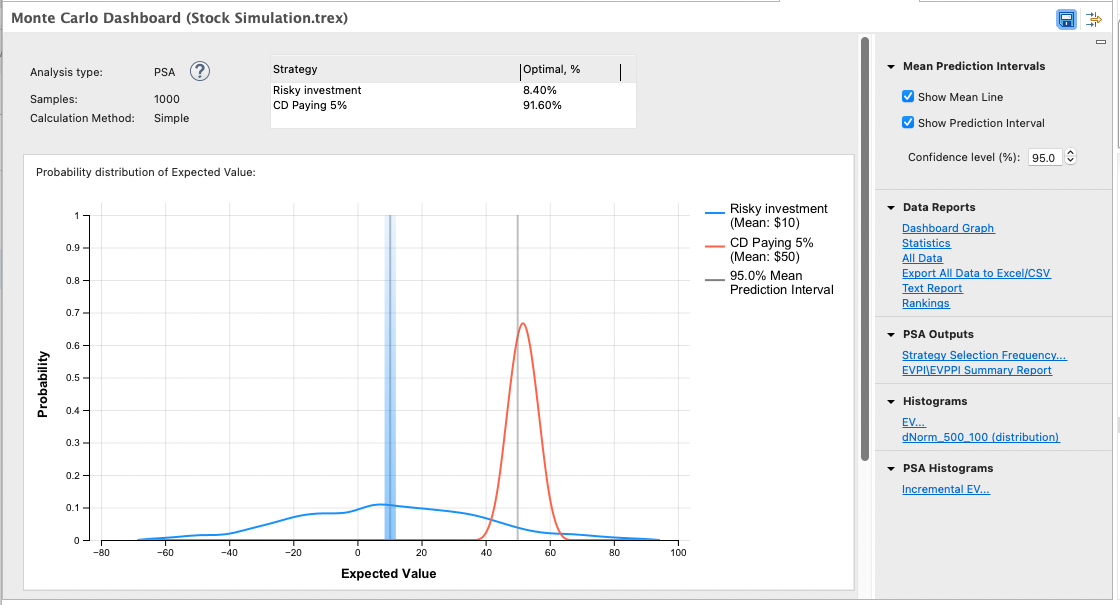
The PSA Dashboard provides a direct view into the underlying results as well as access to additional graphs and reports.
-
Analysis Information: This includes the analysis type, number of iterations (in this case samples) and model calculation method.
-
Summary of Results: A table showing the percentage of model calculations that favor each strategy.
-
Probability Distributions of model output: A probability distribution trend line for each strategy showing the mean and variance among model calculations. The vertical lines and shading represent the mean values and the prediction interval around those means. You can open and edit this graph using the link in the Data Reports.
-
Quick links to commonly-used outputs: Click on the icon to open the associated graph or report.
-
Full list of data reports and graphs: To the right of the Dashboard is a full list of links to all reports. The individual reports are described in subsequent sections of this chapter.
Data Reports
The Data Reports grouping provides access to individual model calculations and statistics drawn from those calculations.
The Dashboard Graph link allows you to open the Probability Distribution trend line graph for editing as required.
The Statistics report displays aggregated statistical data from the model calculations and for every model output.
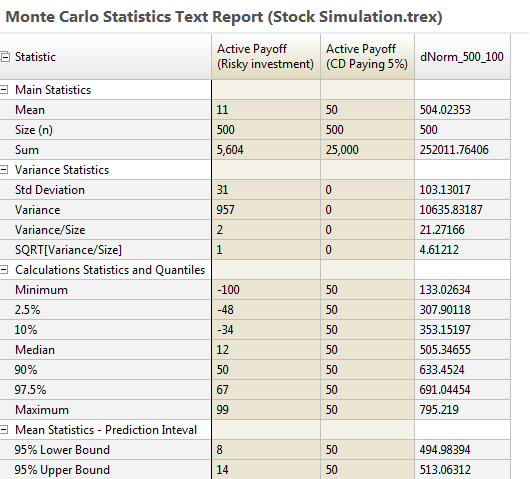
The Statistics Report includes controls to the right to change the percentages for the Prediction Interval mean statistics and to hide/show different data values.
The All Data text report displays all final outputs for each model calculation.
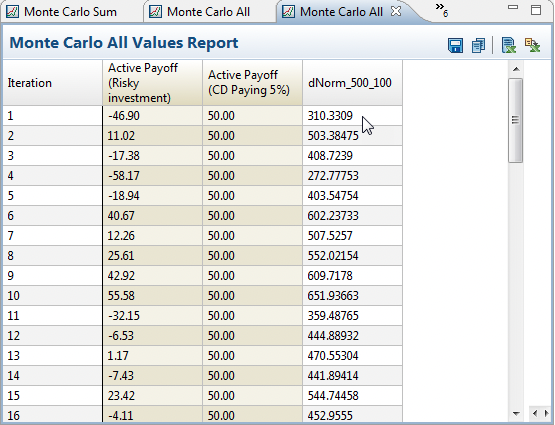
The Export All Data to Excel/CSV link exports the same data from the All Data report to a CSV file easily opened in Excel.
PSA Outputs
The PSA outputs (as seen listed on the RHS of the main PSA Dashboard) are Strategy Selection Frequency and EVPI/EVPPI Summary Reportsplit into the following reports.
-
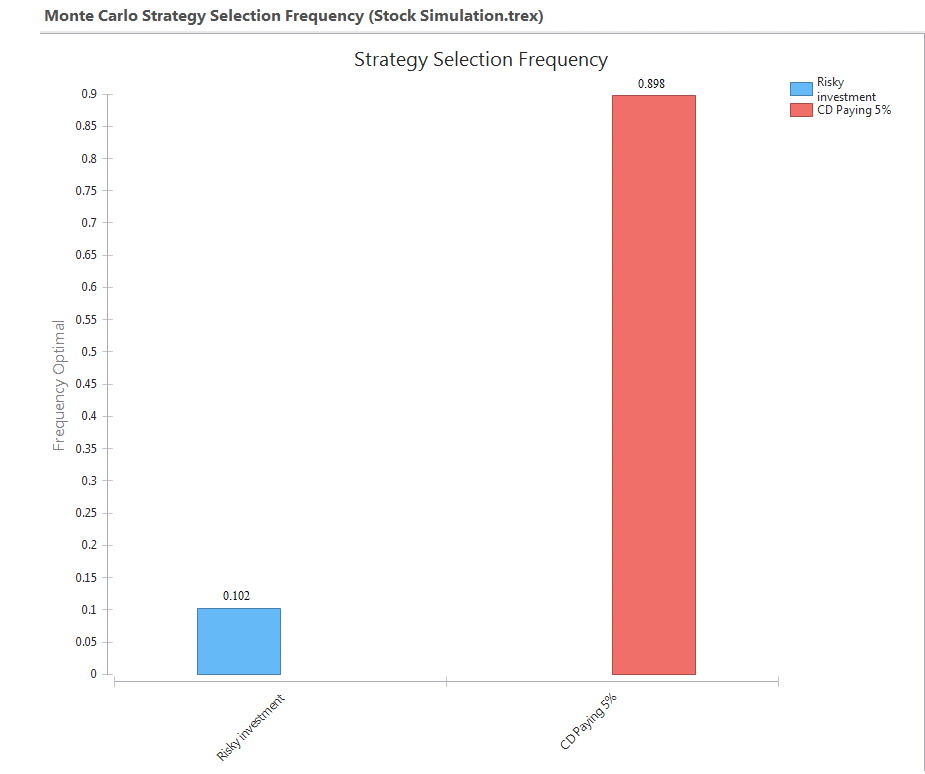
Strategy Selection Frequency: This generates the Strategy Selection Frequency graph which shows the percentage of iterations for which each strategy is optimal. You will be promoted for an indifference threshold which specifies the minimum significant difference between strategies such that one is optimal. The graph is presented below.
-
EVPI\EVPPI Summary Report: More details about the EVPI\EVPPI can be found in the following section called Expected Value of Perfect Information (EVPI\EVPPI) Reports and Charts.
Histograms (Sampling Distributions)
Histograms are available to examine a distribution or results graphically.
Output Histograms
A histogram can be generated for every model output. If the model included extra payoffs, histograms would also be available for those.
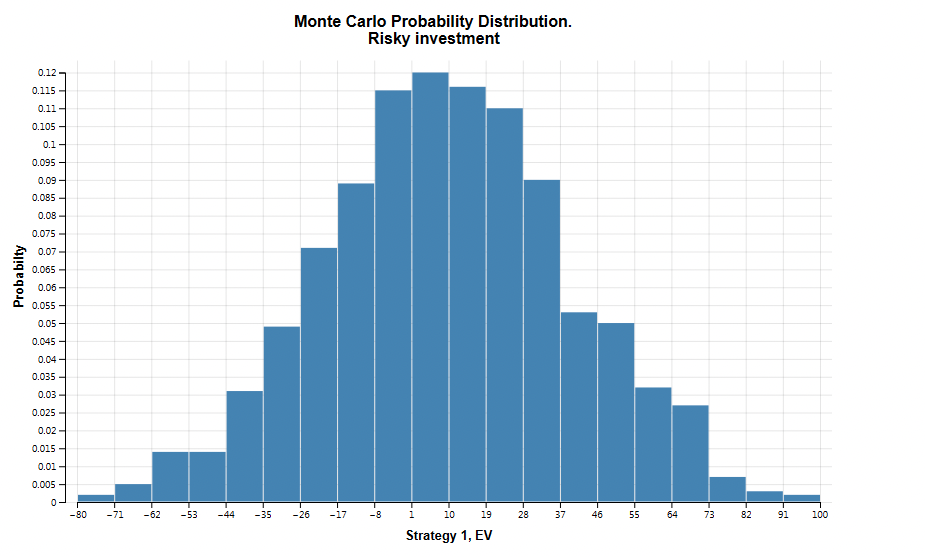
In this model there is a single subgroup histogram EV (expected value), and when selected you choose a strategy (Risky Investment and CD Paying 5%). Other models/simulations can include other types of outputs. See the figure below.
The graph below shows the probability distribution for the Risky Investment strategy's expected value.
Sampling Distributions
A histogram can be generated for every input distribution in the model.
In this model, only one distribution has been sampled, but when more distributions are sampled additional links would be available.
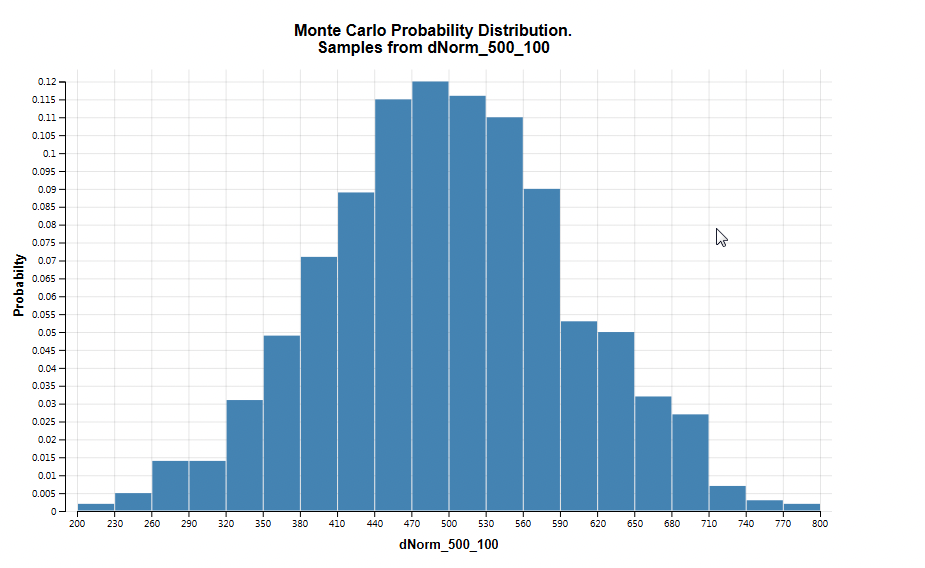
Selecting a link for a given distribution will allow you to generate a probability distribution graph (histogram) for each of the distributions sampled in the analysis. In this case, dNorm_500_100. When you click on a link for a distribution, you are prompted for an approximate number of bars to include in the probability distribution. After entering a value, the probability distribution is displayed, as in the figure below.
PSA Histogram
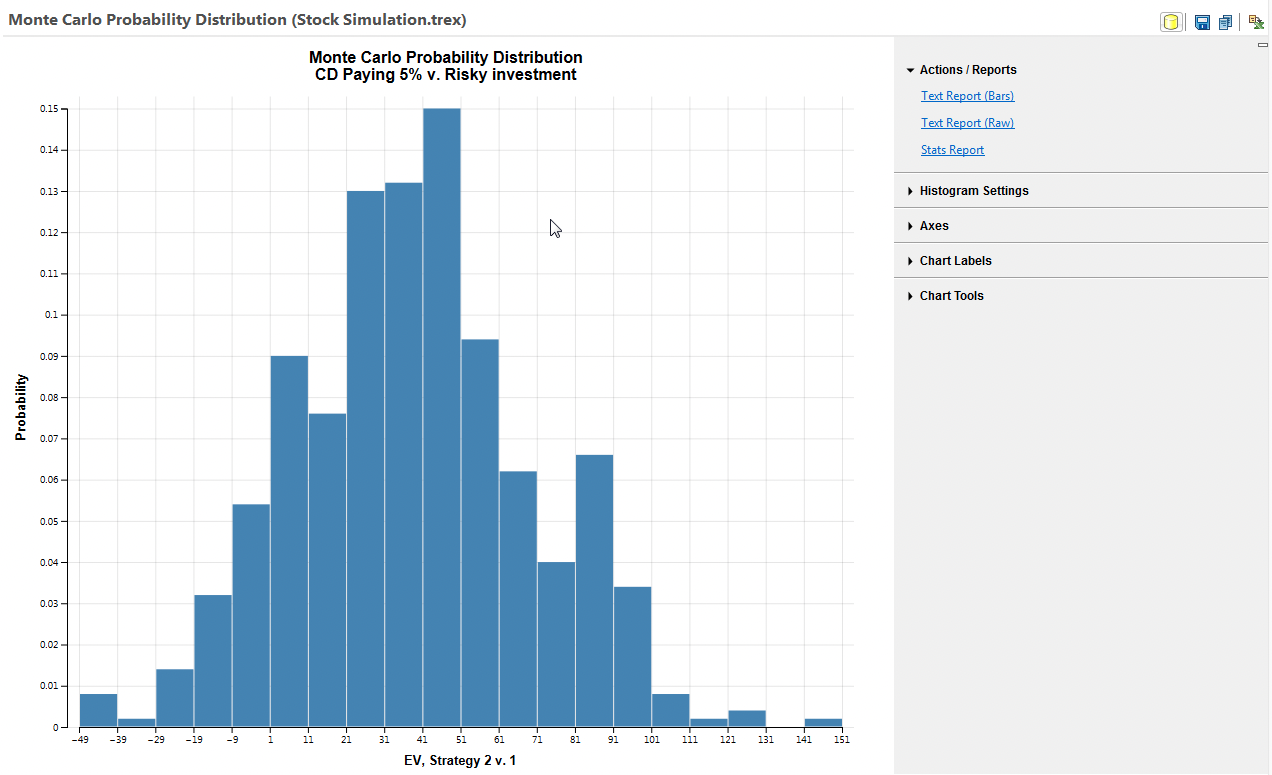
There are specific histograms related to PSA. These are the incremental histograms. In this section you can find output distributions for Incremental EV. This gives the incremental EV for a pair of strategies. A dialogue will prompt you to select a pair of strategies.
Expected value of perfect information (EVPI)
Expected value of perfect information (EVPI) represents the difference between the value we could achieve by making a decision based on perfect information relative to the decision we must make on imperfect information.
More details about EVPI can be found in section Expected Value Of Perfect Information.
