32.7 Histograms
Cost-effectiveness simulations generate many outputs, including cost and effectiveness for each strategy. For each of these outputs, you can generate a probability distribution histogram.
In cost-effectiveness simulations performed at decision nodes, distributions are available not only for each strategy’s cost and effectiveness values, but for incremental values as well. Incremental distribution graphs compare one strategy to a baseline strategy.
Histograms are available for all outputs - NMB, payoffs and trackers - as well as for input distributions.
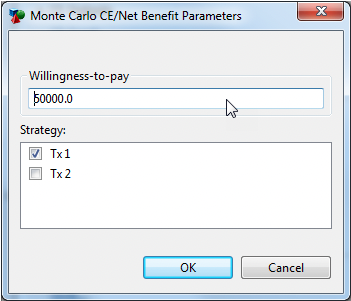
When you click the link for the specific data value, you then must choose the strategy you want plotted. In the option below, the NMB value was chosen, which also requires a WTP parameter.

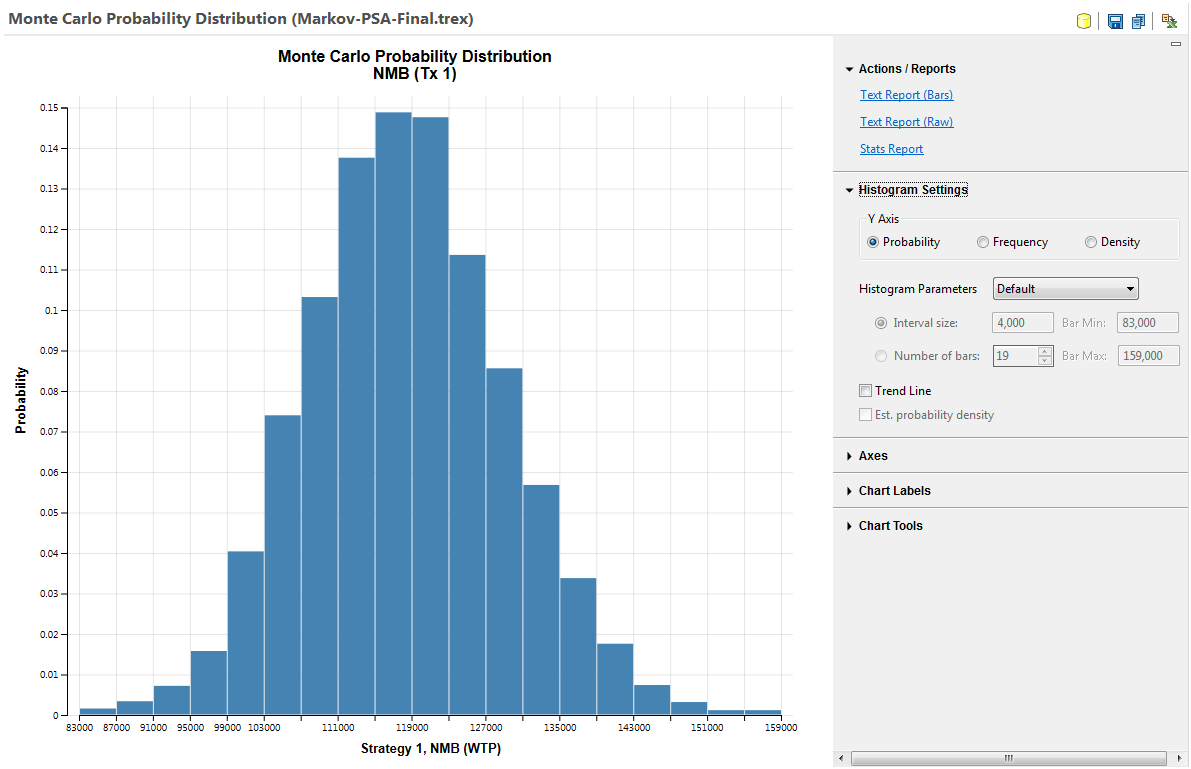
The Output histogram for NMB is shown below.

More details about customizing histograms can be found in the Customizing Histograms section.
