37.2 Constructing a state transition diagram
The tutorial in this chapter explains in detail the commands needed to build a state transition diagram loosely based on the three state Markov Cancer model Markov Cancer Decision.trex as described in Building Markov Models.
To get started, you will need a new state transition diagram document.
To create a new state transition diagram:
-
Choose File > New State Diagram from the menu.
Adding and selecting states
Unlike a new tree, which starts with a root node, a new state transition diagram window is completely blank.
The tool bar above the state transition diagram editor has tools specific to adding states, arcs and converting the STD into a Markov model.

The first step in building the diagram is to add the required states. Let’s start by creating the three states we need.
To add a state to a state transition diagram:
-
Select the add state tool from the toolbar.
-
Repeat this 2 more times until you have 3 states added, as in the figure below.
-
You can move the states by selecting them with the left mouse key, holding it down and then dragging them around.
-
Selecting any state will highlight the container it sits in so you can change the size by dragging the corners, as you can see for State3 below.
-

TreeAge Pro indicates that the state is selected by showing a rectangular outline with resizing markers on every corner and every edge. The node will contain the index value and a name (which we can change later).
When the state is not selected, the rectangular outline will disappear.
Entering the state labels
Whilst the states have generic names (State1, State2 etc...) you should enter a word or brief phrase in the text box to describe the health state.
To enter/edit the state label:
-
Select the state.
-
Click on the existing state label or the middle of the state.
-
Type the state label text (in this case Local Cancer) in the text area.
-
Click outside the state to deselect it.
To force a carriage return in a label press Control + Enter within the text.
Using the same process, add names to the other states - Metastases and Dead.
The STD should now look like the image below:

Adding arcs
Arcs are used to show transitions between pairs of states. The arrow head at one end of the arc indicates the direction of the transition.
To draw an arc:
-
Select the arrow with a "+" in the toolbar and a dialogue will open (as in the figure below).
-
Use the drop down arrows to select the Starting state and the Ending state based on the transitions you want to create.
-
Select Local Cancer for the Starting state
-
Select Local Cancer for the Ending state.
-
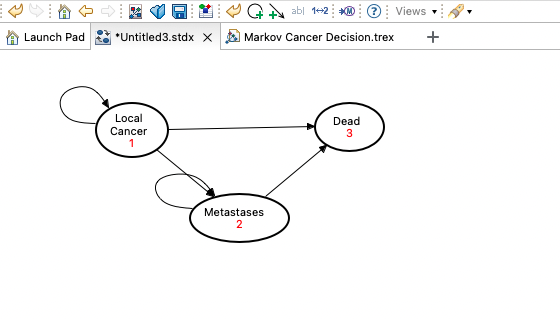
This will draw an arc which loops back to the Local Cancer state. (In the Markov model that will be equivalent to the Stay Here transition).
-
-
Continue this process for all the other transitions.

When you have added the other arcs, the STD will look like the figure below.

It is frequently useful to add a comment (or label) to describe the relationship represented by the arc.
To edit an arc label:
-
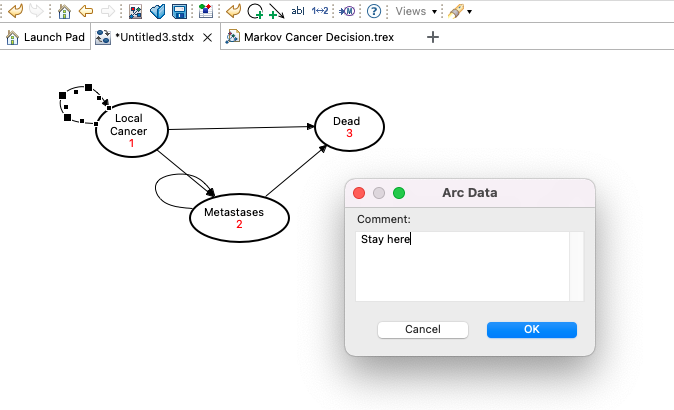
Double-click on the arc.
-
Enter text "Stay here" into the Arc Data dialog Comment field (as below).
-
Click OK.

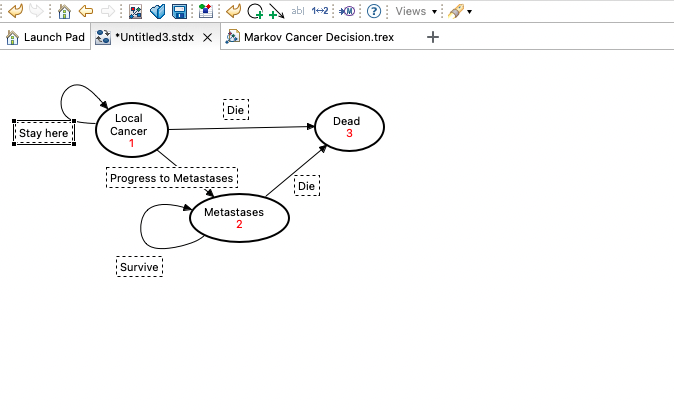
The figure below shows the label associated with the arc which goes from Local Cancer back to Local Cancer.

You can select the label separately to the arc and move it to place it in a better location.
To move an arc label:
-
Click on an arc label and drag it to a new location.
To bend an arc:
-
Select the arc.
-
Click on the bend point in the middle of the arc and drag it in the direction you wish to bend the arc.
-
Release the mouse button.
Once an arc has been bent, additional bend points will appear on either side of the bend point that was moved. This allows for more complex arc curvature.
Now, we can add the other labels for the other arcs.
-
Progress to Metastases: from Local Cancer to Metastases.
-
Die: from Local Cancer to Dead.
-
Survive: from Metastases to Metastases.
-
Die: from Metastases to Dead.
The state transition diagram is now complete.

More editing options for STDs
Additional options for editing state transition diagrams are described in this section.
To move a state:
-
Select a state and drag its outline (not a resize point) to a new location.
When a state is moved, the arcs attached to it will move accordingly.
To cut a state:
-
Select a state.
-
Choose Edit > Cut from the menu or press Control + X on the keyboard. Arcs attached to the state will also be cut.
To resize a state:
-
Select a state.
-
Click and drag one of the resize marks on the rectangular outline around the state.
To select multiple states:
-
Select one state then hold down the Shift key and select another state.
-
... Or...
-
Click on open space in the diagram and drag to create a rectangle that surrounds all elements you wish to select
To delete an arc:
-
Select the arc.
-
Press the Delete button on the keyboard.
To bend an arc:
-
Click on the arc points and drag it to another location. Rather than moving the entire arc, it will be split into two line segments, each terminated at the new drag location.
-
You can bend this further by dividing up those line segments using the same technique.
To arrange all states evenly:
-
Choose Edit > Auto-arrange states.
