44.2 Editing and Extending a Hazard Table
Once you have a hazard table showing changes in the hazard rate over time, you can use the Hazard Table Editor to edit and extend the hazard data.
Let's start by converting survival data (prev section) from a limited dataset where the Hazard Table Editor becomes quite useful. For this section we will use the Standard conversion method, which generates a noisier hazard table. This is better for illustrating the Hazard Editor after the conversion.
-
Open model Hazards-HazardEditor.trex.
-
Open the Tables View.
-
Select the table KM_Table.
-
Click the "Convert to Hazard" icon in the toolbar.
The conversion dialog will display as shown below.
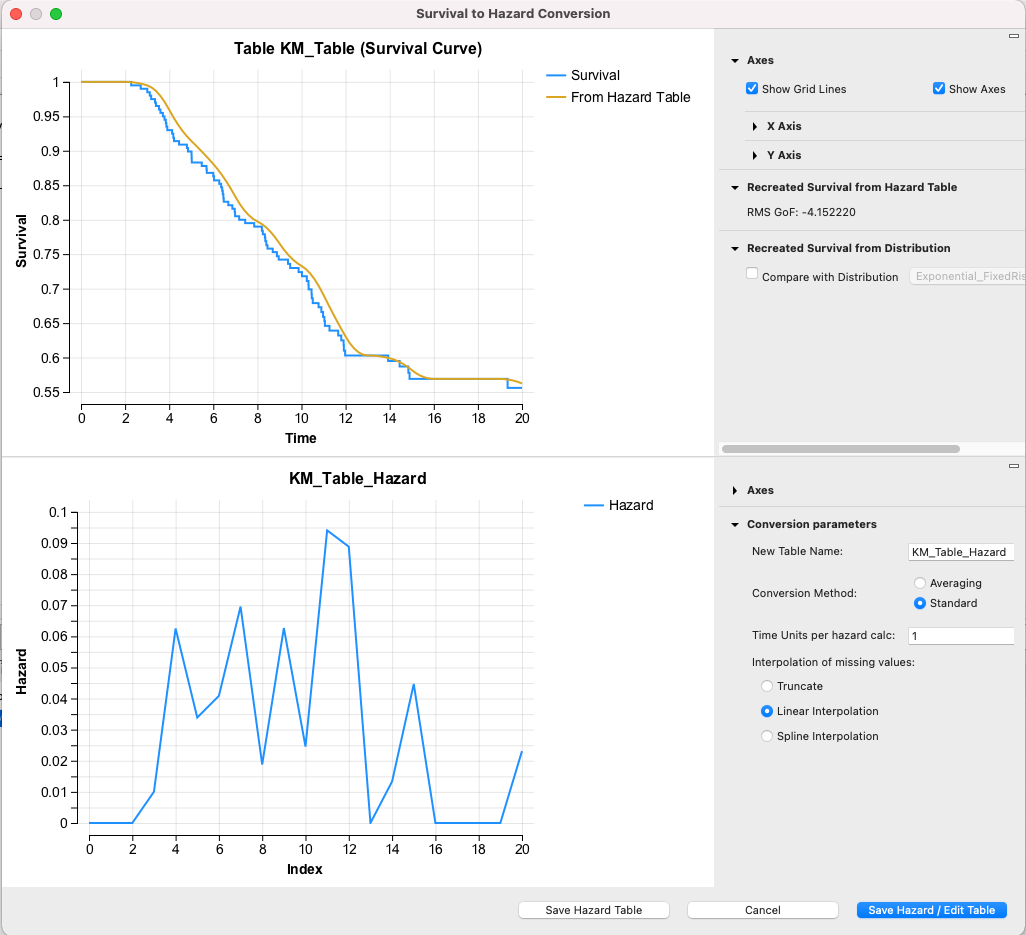
Note that the hazard rates are using the default Interpolation of missing value which is Linear Interpolation. Rather than just save the hazard table, click the Save Hazard / Edit Table button to open the new hazard table in the Hazard Table Editor as shown below.
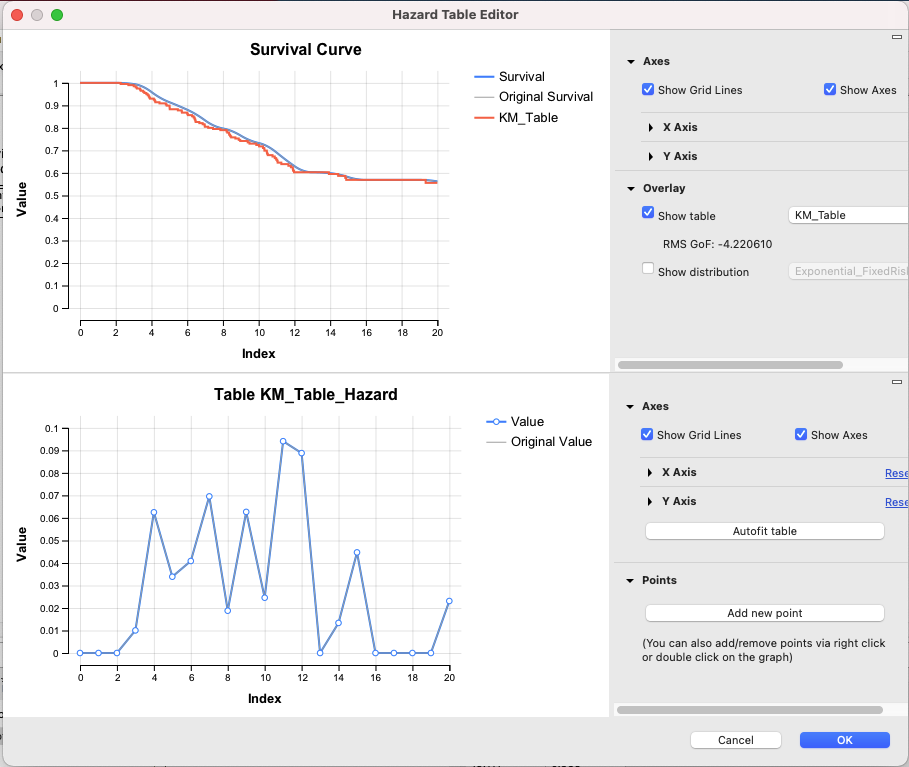
The Hazard Table Editor shows the hazard table in the bottom pane and the resulting survival in the top pane. Because we generated this via the survival-hazard conversion, the original survival table is overlaid in the top pane. A Goodness of Fit (GoF) measurement is also provided to show how close the current hazard-generated survival is to the original survival table. You can also overlay a parametric distribution for comparison. For more details about Goodness of Fit, see the section Appendix: Goodness of Fit.
The Hazard Table Editor allows you to graphically modify the hazards in the bottom pane and immediately see the impact on survival in the top pane. You can drag points in the Hazard table as well as add points (button to right) or delete points (via right-click). In the image below, the hazard table was smoothed out to make it more realistic. It was also extended by 10 years for a time horizon that extends beyond the collected survival data.
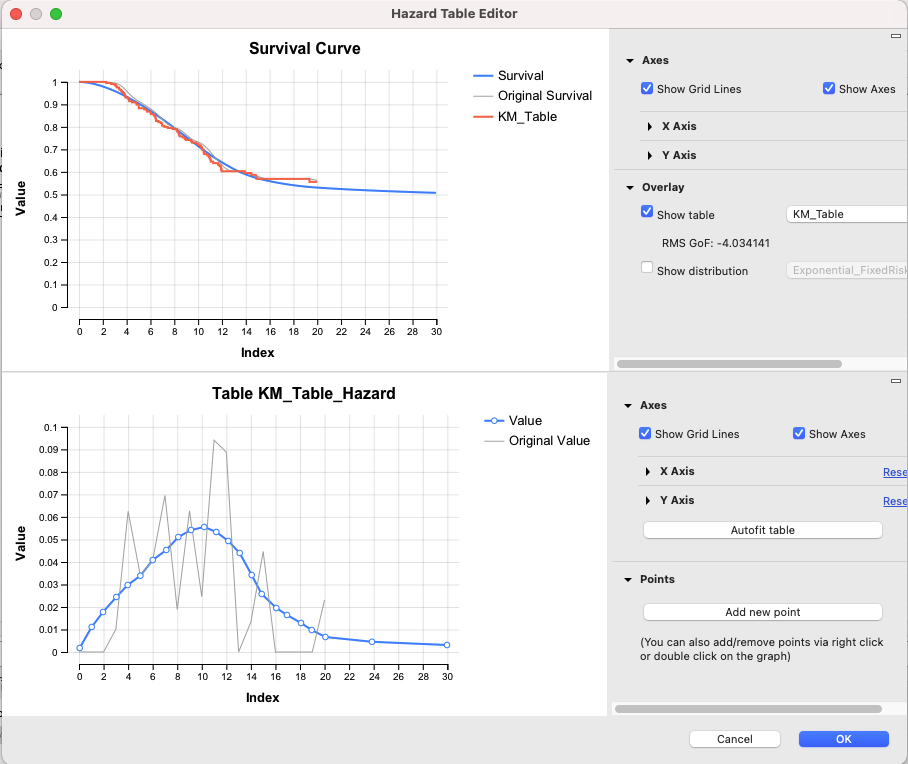
Note that the blue plots the edited hazard data while the gray plots the original hazard data. Both current and original data are converted to survival in the top pane.
Click OK to save the edited hazard table data or Cancel to return to the original table data.
The Hazards-HazardEditor.trex model structure artificially includes two versions of the same OS curve for comparison purposes - one uses the original survival data and the other uses the edited hazard table.
Run the hazard and survival curves:
-
Select the PartSA node.
-
Choose Analysis > Partitioned Survival Analysis > Hazard Curves from the menu.
-
Choose Analysis > Partitioned Survival Analysis > Survival Curves from the menu.
The resulting graphs are shown below.
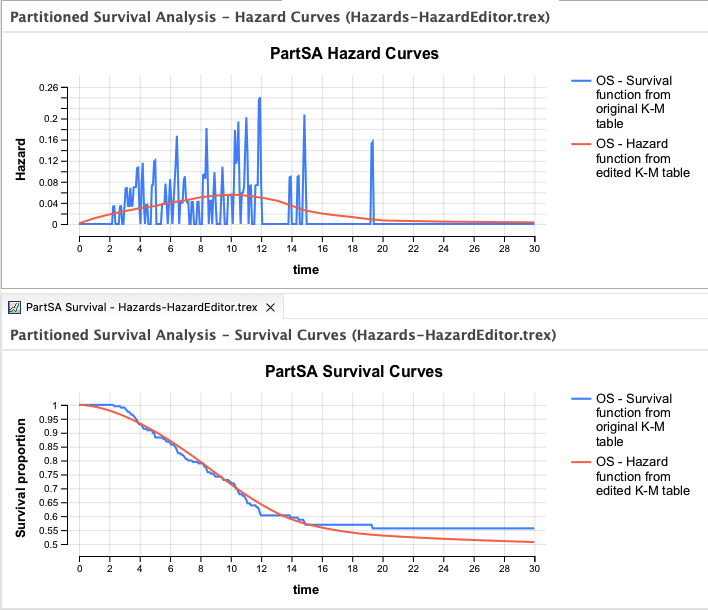
Note the impact of smoothing out the hazard table. Also note that the original converted hazard curves show zero risk at year 20, which would be unrealistic to use for extension (extrapolation) through year 30.
