44.3 Using Hazards in a PartSA Model
The prior sections have described how to import, convert and edit hazard tables. Now we will incorporate hazards into models. We will use the CDC hazard data from section Calculating Hazards from Survival Data as our source data to build a Partitioned Survival (PartSA) model.
Healthcare Example Models Hazards-CDC-PartSA.trex includes two tables; KM_CDC is the original Kaplan-Meier data from the CDC, and KM_CDC_hazard is the data converted to hazards (see earlier section Calculating Hazards from Survival Data).
TreeAge Pro PartSA models can use both survival functions and hazard functions to define the Survival Curves. This model uses the converted hazard table data to calculate survival (indicated below the Survival Curve OS - Hazard function from edited K-M table by the "H").
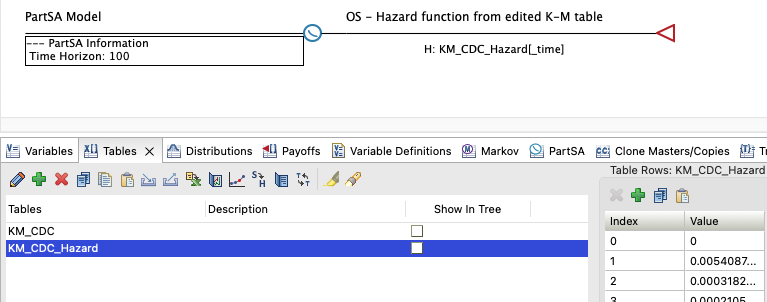
The hazard function references the table KM_CDC_Hazard using the keyword _time. As _time progresses continuously in the model, the hazard rate is pulled from the table (using interpolation as defined by the table properties).
The image below shows the Hazard function, the Survival function and the original K-M data from the CDC. As the population reaches older ages, the risk increases, so survival starts to drop significantly.
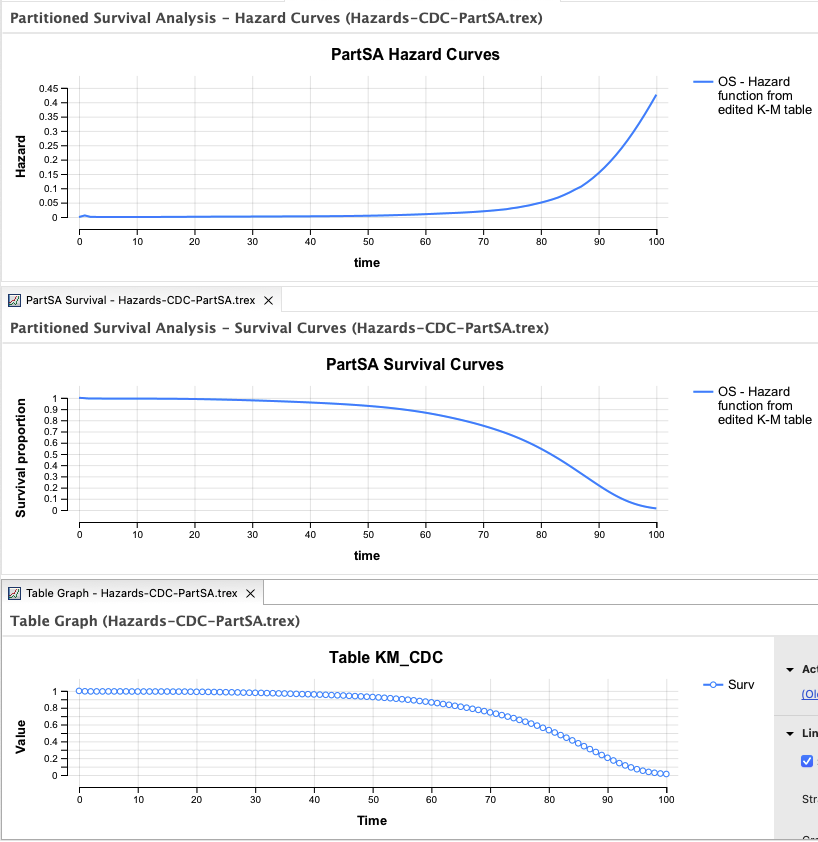
You can see the survival curve from the model match the original K-M data (the middle graph is the survival curved and the bottom the K-M data).
Roll back indicates that the life expectancy from the CDC data is 77.5 years.
The use of hazards allows more flexibility than using the original survival data. For example:
-
Model could start at age 50, and the hazard data could shift to use the hazard data at age 50 and at _time 0.
-
Treatment or disease affect can apply a ratio to the underlying baseline hazard to adjust it up and down.
-
Sensitivity analysis could be applied to represent uncertainty around the hazards at any time.
