38.6 Survival Curve and Hazard Curve Graphs
Once the model structure is in place along with the Survival or Hazard Function for each Survival Curve node, you can generate a Survival Curve Graph to plot the Survival Functions against time.
To generate the Survival Curve Graph:
-
For the Partitioned Survival Analysis Example Model, PartSA-Example.trex, select the PartSA node.
-
From the menu, choose Analysis > Partitioned Survival Analysis > Survival Curves.
-
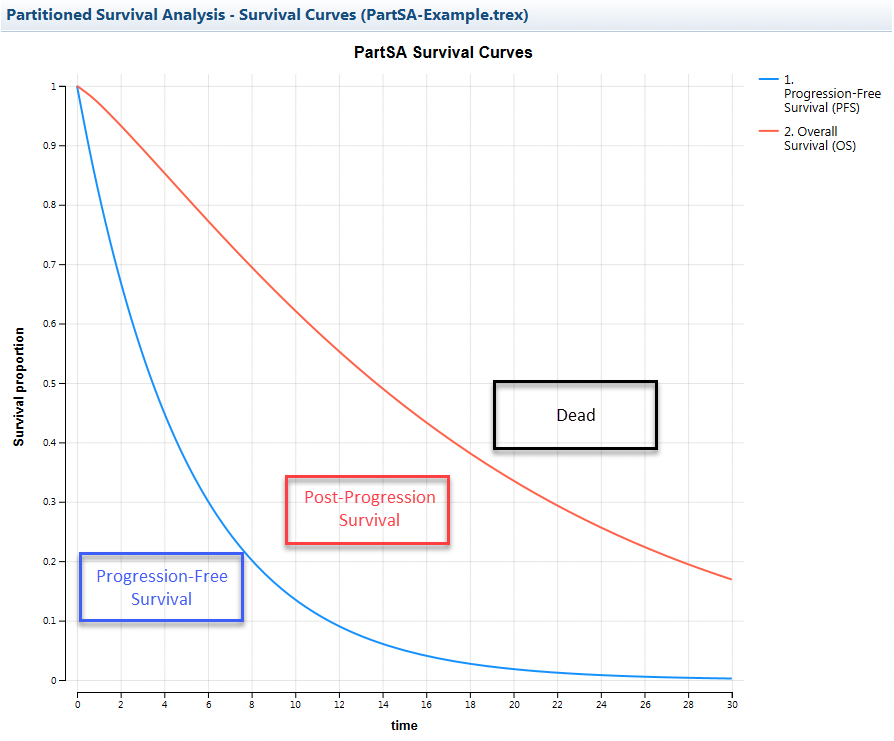
In the figure below, we have added the states on top of the PartSA Survival Curves generated, including the implied state, Dead.

Each Survival Curve is plotted against time over the full time horizon. Since each Survival Curve represents progression from one state to the next, state membership is represented as the areas around the survival curves as annotated in the figure above.
Survival Curves can be combined for different strategies. In the Actions/Reports options to the right hand side of the graph, there is the option to Combine. By selecting this, you can choose the other graphs (of the same type) to combine. Options on editing graphs, from labels to axis and many other things are described in the Graphs chapter. It is also possible to rescale the x-axis for a different time period for both Survival Curves and Hazard Curves.
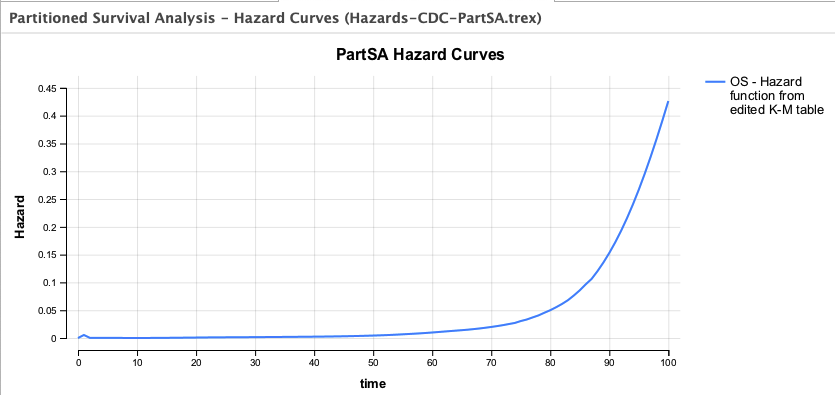
You can also generate Hazard Curves that track the changing hazard over time.
To generate a Hazard Curve Graph:
-
Open the Healthcare Example Model Hazards-CDC-PartSA.trex.
Select the PartSA node.
-
From the menu, choose Analysis > Partitioned Survival Analysis > Hazard Curves.

The graph shows the increasing risk of death from background mortality with age based on 2022 CDC data.
Both the Survival Curve and Hazard graphs' data can be exported to a table for further evaluation.
To generate a table from any series of a line graph:
-
Generate the graph.
-
Click the "Convert to table" link to the right of the graph under "Actions".
-
Select an open model to which the table will be added.
-
Enter the table name.
-
If there are more than one series in the graph, choose the series.
A new table will then be included in the selected model.
