36.6 Infectious disease patient level model
Infectious disease models in TreeAge Pro can be run as either cohort or microsimulation (parallel) trials analysis. This section looks at an Infectious Disease model analyzed via microsimulation (parallel) trials.
Infectious disease models are a specific class of models because they depend on the current membership of the health states, which impact the transitions between health states. Simply, the number of people in the infected state impacts the likelihood of an uninfected person becoming infected.
Again, this section (as in the previous section) will consider a Susceptible–Infected–Recovered (SIR) epidemiological model, which computes the theoretical number of people infected with a contagious illness over time. The name of this type of model derives from the set of health states: number of Susceptible people (S), number of people Infected (I), and number of people who have Recovered (R). Transitions from one state to another in the model can be derived mathematically, and while the derivation is out of scope of this manual, more details can be found here.
In addition to the SIR patient simulation model requiring an understanding of Dynamic Cohort models (the rest of this chapter) it also requires an understanding of Parallel Trials models, covered in the chapter Microsimulation with Parallel Trials.
Consider the Healthcare tutorial example, Dynamic Parallel Trials - Infectious Disease.trex, shown in the figure below.
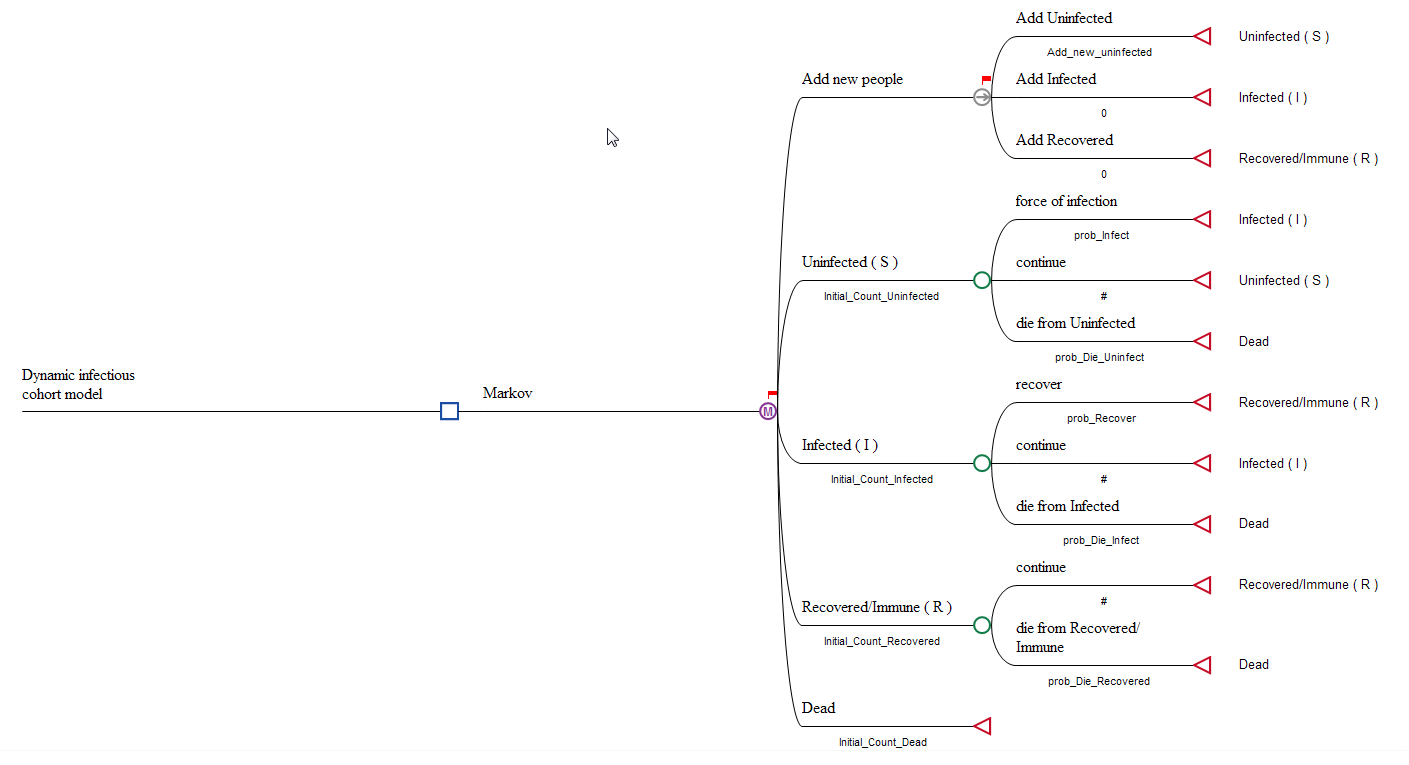
Refer to the details provided in the previous section (Infectious disease cohort model) about the SIR Model structure.
Differences between Cohort and Parallel Trial Infectious Disease models
The Cohort and Trial models are mostly identical in structure. The differences between the two types of simulation in this model are:
-
Parallel Trials: Due to the nature of infectious disease models, trial (microsimulation) models cannot be run sequentially. Each trial's state of infection impacts all other trials, i.e. the more trials who are infected impacts the probability of infection via the variable Proportion_Infected. Therefore trials need to be run through the model in parallel, allowing the number of trials in each health state to impact the trnasition probabilities.
-
Integer "probabilities": When new people are added to a Microsimulation model, "whole" new people need to be added because they are equivalent to a new trial being created in the model. We overcome this by using the integer part of Add_new_uninfected.
-
Running the model: A microsimulation model is run from the decision node using any of the options to run a Microsimulation model. Because of non-coherence, the dialogue does not present the option to enter the number of trials. This is taken from the initial probabilities in the model.
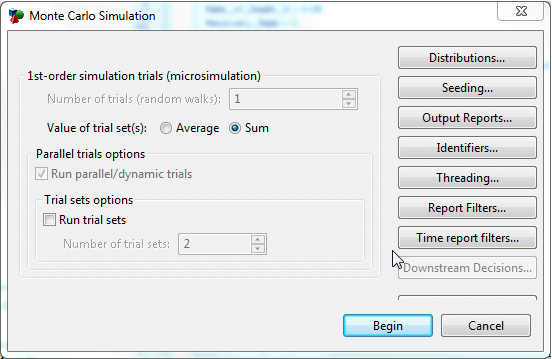
The Value of trial set(s) can be selected as either Average or Sum. The Sum of the set considers the total values (of cost and effectiveness in this model) over the whole of the population.
-
Patient Tracking Reporting: To consider the movement of the population over time, trial and cohort level details can be found using Patient Tracking Reports. This model has patient tracking turned on, collecting Cost and Effectiveness. Details about patient tracking can be found in the Microsimulation Chapter in the section Patient Tracking Reports. After running microsimulation, open Patient Tracking Reports and select the radio button for Cohort. In the dashboard which opens then select the Charts > State Probabilities to show how the proportion of the population in each state changes over time, as in the figure below. More details can be found in the section about Analysis for Parallel Trials.
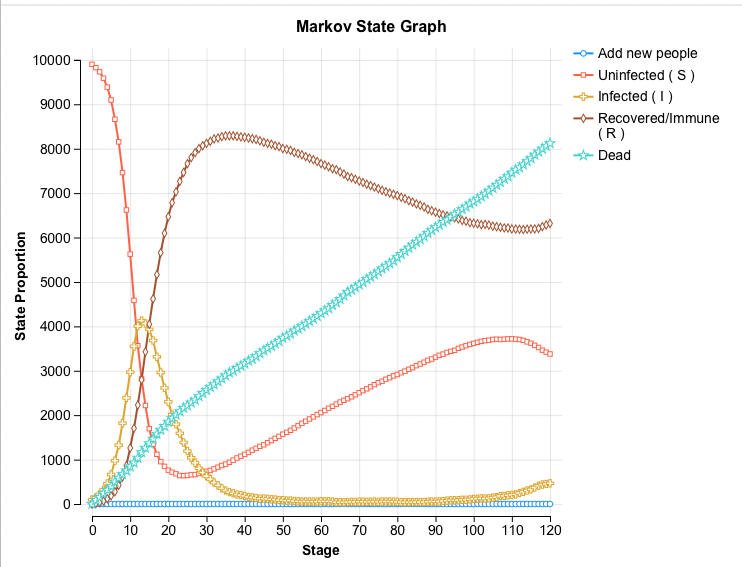
As with all microsimulation models, the accuracy of the results depends on the number of trials. In the cohort model described in the previous section, the number of trials was not important in the calculation of the transition probabilities because the model considered proportions of the cohort. With this parallel trials model, the number of trials can impact the results. The outputs, such as the State Prob graph above, will converge to the cohort model with more trials, i.e. the more trials mean a more accurate result.
This parallel trials model does require 10,000 trials to provide accurate results like in the cohort model. The model also requires the use of time reporting to capture all this information so that is can be displayed (as we see above in the State Prob graph). This is computationally intensive, and while the generate of the results may be a few minutes the saving and then generating graphs can take some time. Please be aware of this if you are running the example microsimulation (parallel trials) model.
