20.5 Decision Tree Pathway report
The Decision Tree Pathway report allows you to follow the calculations within a model strategy. Specifically, you can track the following:
-
Probability of reaching each node (path probability).
-
Accumulation of value(s) at each node.
-
Rollback calculations by node.
We will use the Legal tutorial example, BreachOfContract-Upstream-Payoffs.trex to illustrate the details of the report. This model uses Upstream payoffs, which is described in section Entering Upstream Payoffs Along Scenario Pathways.
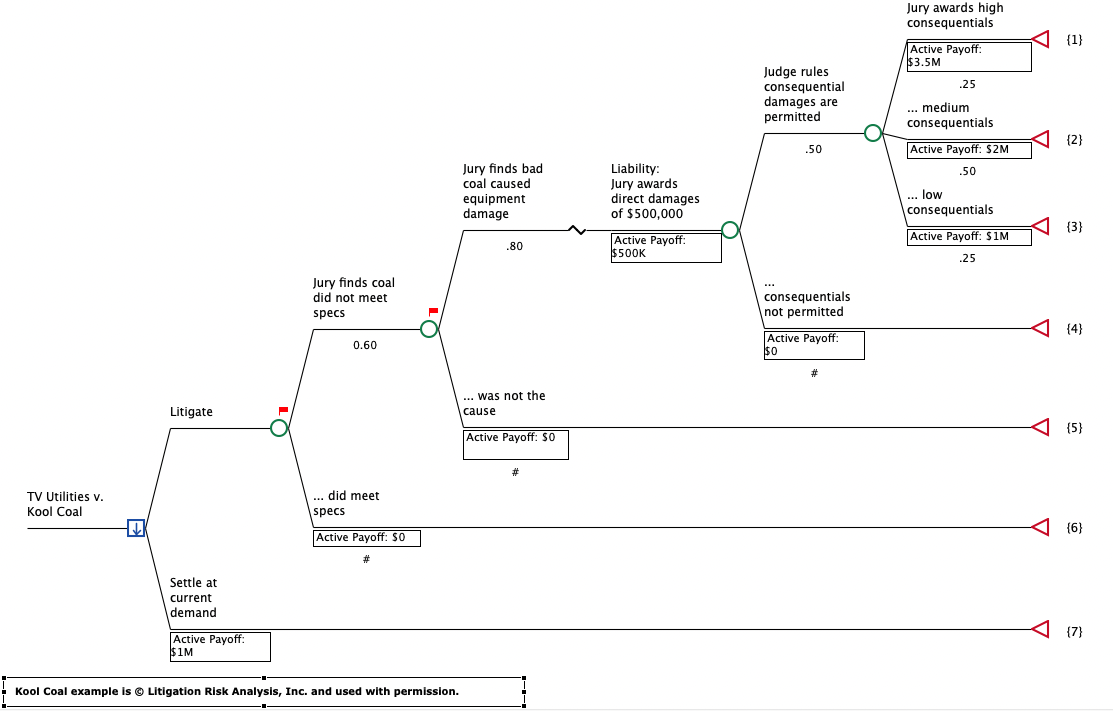
To generate the report, you must first select a Strategy node, which is a branch of the primary decision node for the model. In this model, there are two strategy nodes - Litigate or Settlement Offer.
With a strategy node selected (Litigate), choose Analysis > Decision Tree Pathway Report from the menu.
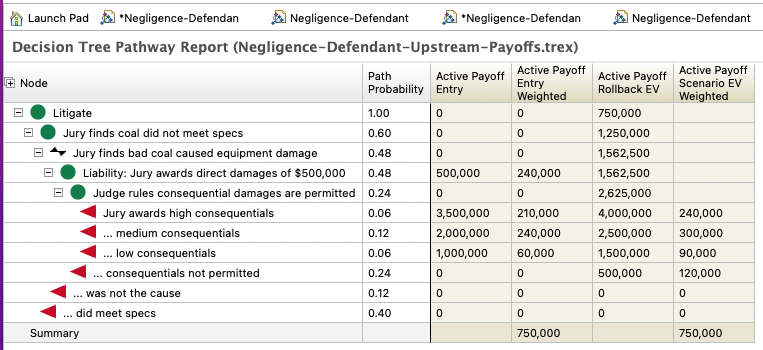
Node & Probability Columns
The first two columns of the report illustrate movement through the strategy's pathways.
-
Node: the label for each node within the strategy
-
Path Probability: the probability of reaching that node
The strategy node itself will always have the full probability of 1. From there, the probability of reaching each node is dependent on all the probabilities along its path.
For example, there is a 0.60 probability of proving negligence (Jury finds coal did not meet specs), so the probability of reaching the Prove Negligence node is 0.6. Further downstream, there are other probabilities:
-
Jury finds bad coal caused equipment damage: 0.8
-
Jury rules consequential damages are permitted: 0.5
-
Jury award high consequentials: 0.25
Therefore the probability of reaching that node is 0.6 * 0.8 * 0.5 * 0.25 = 0.06.
Value Columns
For each enabled payoff, four columns will be displayed. In this model, the payoff label is “Value”, which is included in each column label.
-
Value Entry: the payoff value accumulated at that node (if any)
-
Value Entry Weighted: the payoff value weighted by the probability of reaching that node (Value Entry * Path Probability)
-
Value Rollback EV: the value at that node calculated from rollback (working right-to-left from the terminal nodes)
-
Value Scenario EV Weighted: the weighted value of the scenario ending with a terminal node (Rollback Value * Path Probability)
The first two value columns illustrate the accumulation of value as you move from the strategy node to the terminal nodes (left to right in the model).
At the Jury awards dmanages node, compensatory damages of $500K are accumulated as seen in the Active Payoff Entry column. However, there is only a 0.48 chance of reaching that node (from the first column), so the Value Entry Weighted is 0.48 * $500K= $240K.
At the Jury awards high consequentials node, there is $3.5M in punitive damages (from the Active Payoff Entry column). The probability of reaching that node is only 0.06, so the Value Entry Weighted is 0.06 * $3.5M = $210K.
The third and fourth value columns illustrate rollback calculations working back from the terminal nodes to the strategy node (right-to-left in the model). The third Rollback Value column displays the expected value at each node in the model. These are the same values you would see directly in the model when Roll Back is on.
The fourth column is the weighted expected value of a scenario represented by its terminal node (Rollback Value * Cohort). The weighted values of all scenarios sum to the total value of the strategy.
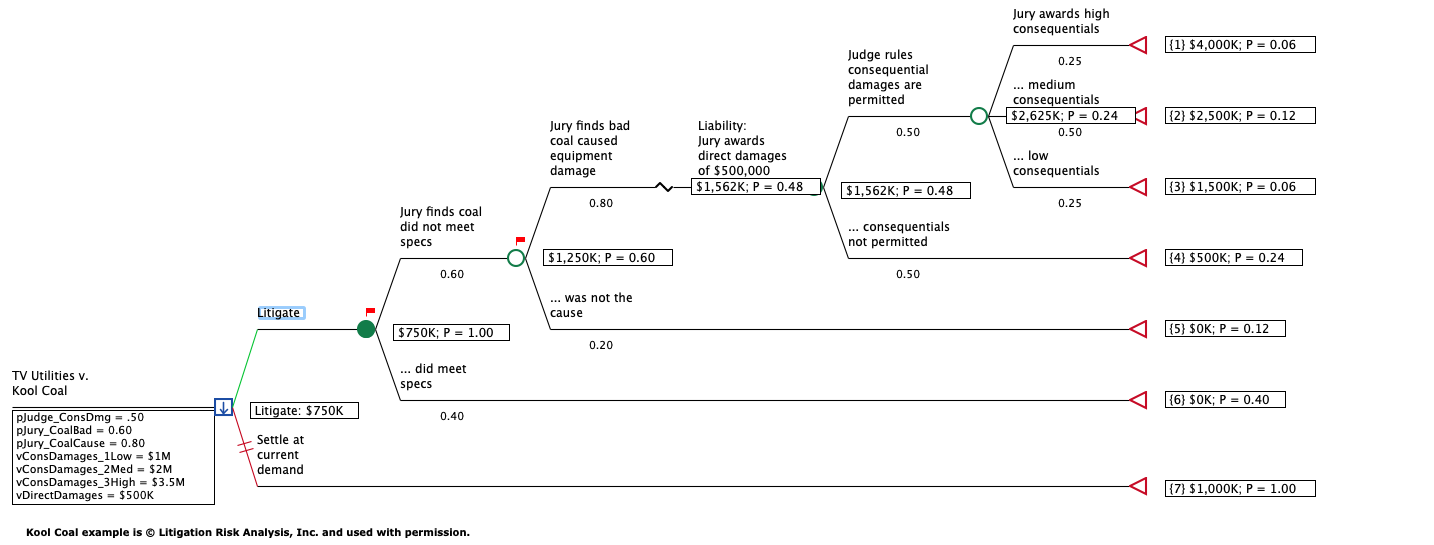
In the example model, the Rollback Value column presents the expected value at that node. At a terminal node, this is the value of the complete pathway from the strategy node to the terminal node. At the Jury awards high consequentials node, the full value reflects all the awards and consequentials.
You can set a constant cohort size to your model, which will multiply all values in this report by that cohort size. Refer to the Roll back section for details.
