6.7 Analyzing a Markov Model
Markov Cohort Analysis reports on the flow of your cohort through the model as well as the accumulation of Cost and Effectiveness associated with that cohort flow.
Lets take the completed model, Markov Cancer Final.trex to demonstrate the cohort flow and the analysis steps. You can run the same analyses on your own model. Markov Cohort Analysis reports back information for a single Markov model/process.
To Analyze a Markov Model:
-
Open the model and select the Markov node within the model.
-
Choose Analysis > Markov Cohort from the menu.
-
The Markov Cohort Dashboard will show the State Probability Graphs for the Health States in the model.
The Dashboard as shown below provides access to a series of detailed graphs and reports related to the cohort analysis
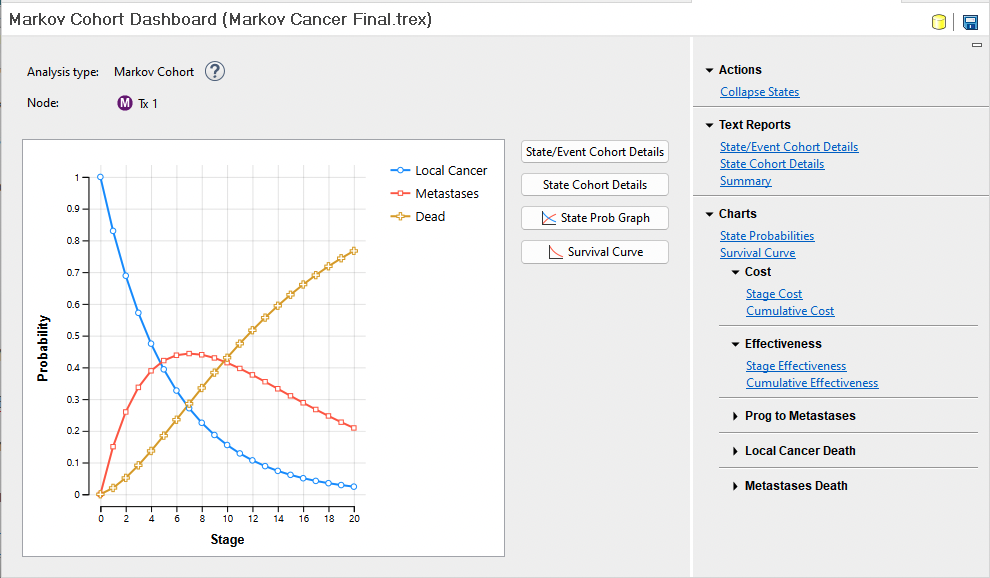
By selecting the link to State/Event Cohort Details, the Markov Cohort Extended Report will open.
Review the flow of the cohort among Health States and Events in the model
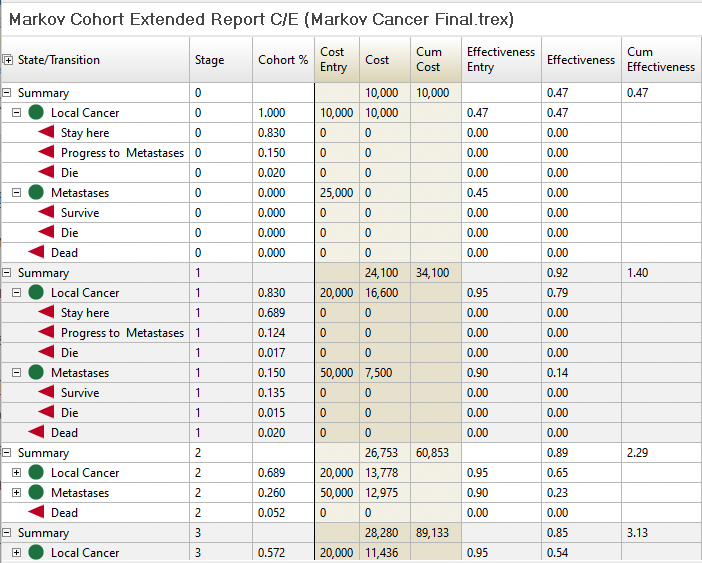
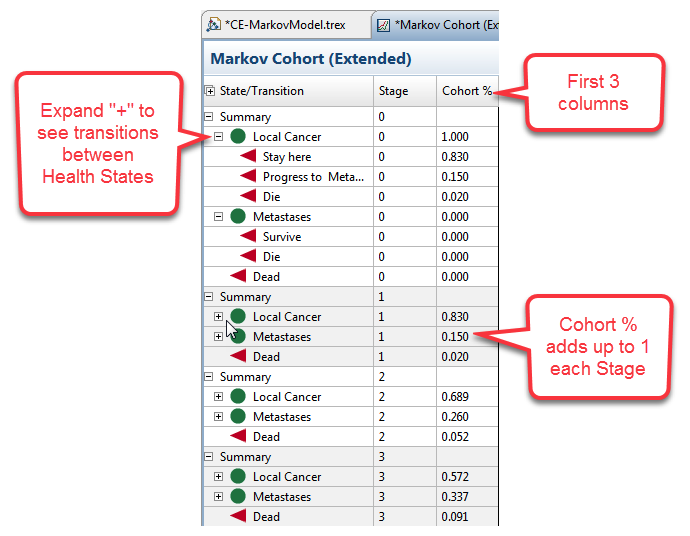
Examine the first three columns to see the Cohort flow.
-
The first column (State/Transition) presents the label for each node in the Markov process, including Health States and Events. Nodes can be expanded/collapsed using the +/- to the left of node labels.
-
The second column (Stage) presents the stage (or cycle counter).
-
The third column (Cohort %) presents the proportion of the cohort that reaches that node in that cycle. In the image below, the entire cohort (1.000) starts the model (_stage 0) in the Local Cancer Health State. From there, 0.830 move to the Stay Here event, 0.150 move to the Progress to Metastases event, and 0.020 move to the Die event. Following this on, in the second cycle (_stage 1), 0.830 of the cohort is starting at the Local Cancer State.
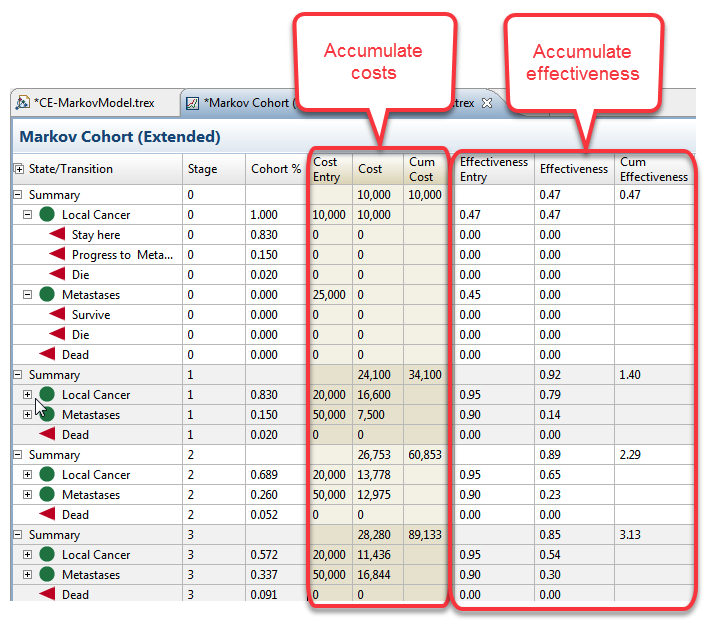
Accumulating Rewards
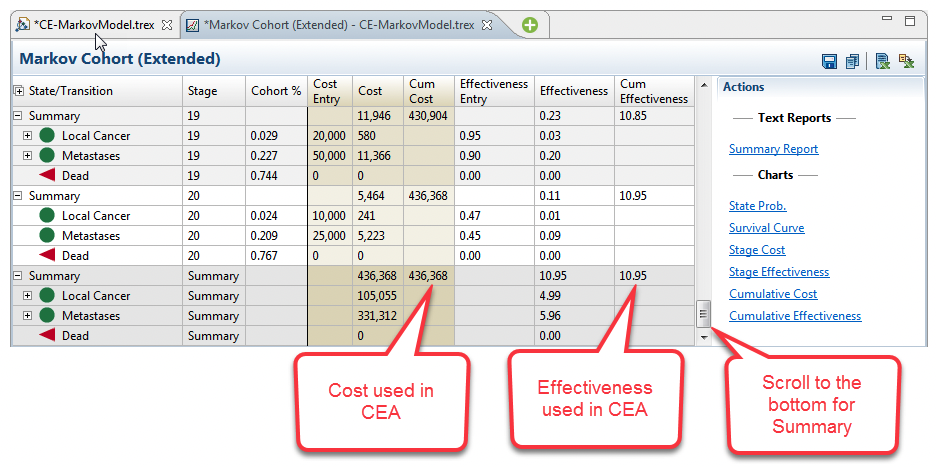
Subsequent columns present the accumulation of Cost and Effectiveness at different States and Events in the model. For example, in the second cycle (_stage 1), 0.830 of the cohort is a the Local Cancer State. The cost reward for that state is 20,000, so the amount accumulated is 16,600 (= 0.830 * 20,000).
Overall Cost and Effectiveness
Scroll to the Summary rows at the bottom of the report to review the total values accumulated at different nodes in the model over the entire time horizon. The summary rows provide a breakdown of which nodes contributed to the overall cost and effectiveness values.
Further details:
-
More in depth details about Cohort Analysis can be found in Markov Cohort Analysis Output. When a strategy has multiple Markov models, output can be consolidated into a single report and more details can be found here: Consolidated Markov Output Per Strategy.
-
Building a Decision Tree with Markov Models as Strategies is very common for Cost Effectiveness Analysis. More information can be found in the section Building and Analysing Cost Effectiveness Models where two strategies are compared.
-
To extend your Markov Models further, the section More Markov Model Tools is where you should look next. It provides details about time dependance, half-cycle correction, cloning, time-in-state (tunnels) and more.
