45.3 Survival Plot - Instructions
This section will describe how to setup the series in the Survival Plot View. We will start with the Healthcare Example Model SurvivalPlot-Setup.trex. Note this model uses the same distributions and tables as SurvivalPlot.trex described in the Overview section, except that we will add the plotter series within these instructions.
45.3.1 Add a Series for a Survival Table
The table tbl_Survival is a Kaplan-Meier table showing declining overall survival declining over time. Consider this to be survival data collected in a clinical trial over 20 months. We will add this as the first series in the Survival Plot below.
-
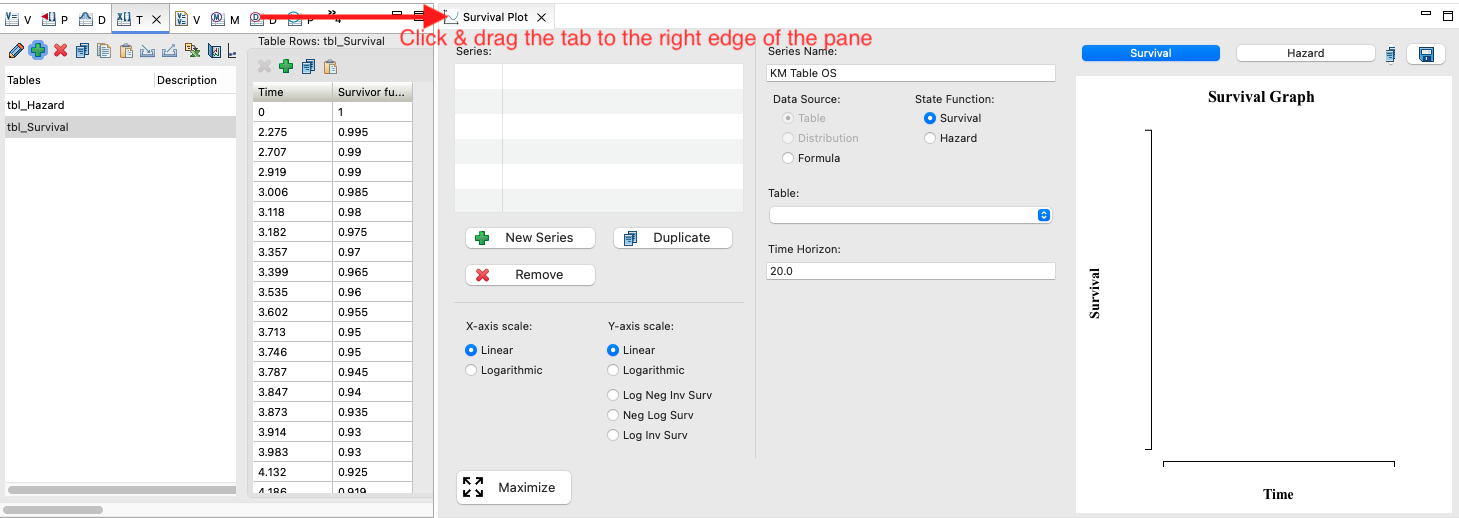
Click on the Views list in the toolbar and choose Survival Plot.
-
Hint: It can be useful to drag the Survival Plot View to the right to split the bottom pane in two with model inputs on the left and the Survival Plot on the right.
-
Click the New Series button.
-
Enter the Series Name KM Table OS.
-
Choose the Data Source option Table.
-
Choose the State Function option Survival.
-
Select the Table tbl_Survival from the drop down menu.
-
The Time Horizon should default to 20.
You will then see the survival table in the Survival Plot graph.
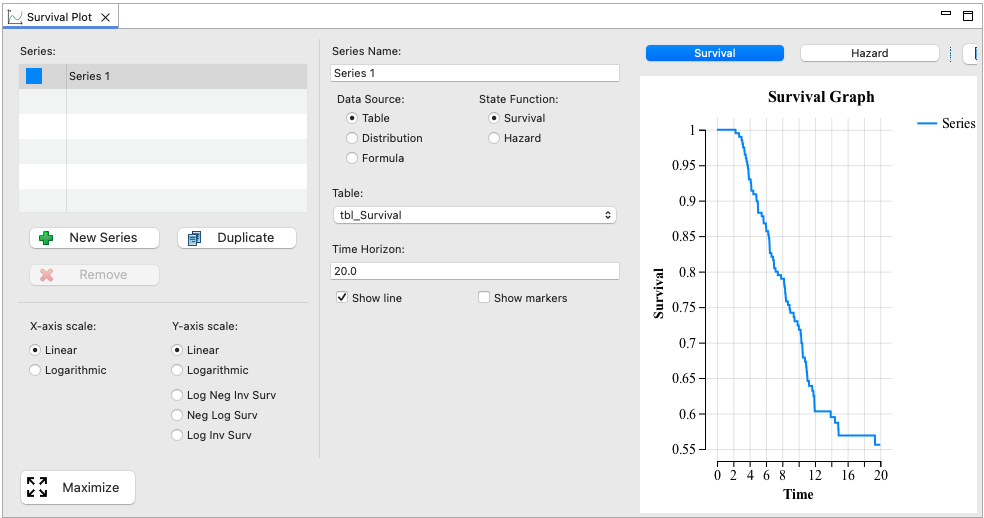
With this representing the original source data, we can now add different survival estimates extending further into the future.
45.3.2 Add a Series for a Survival Distribution
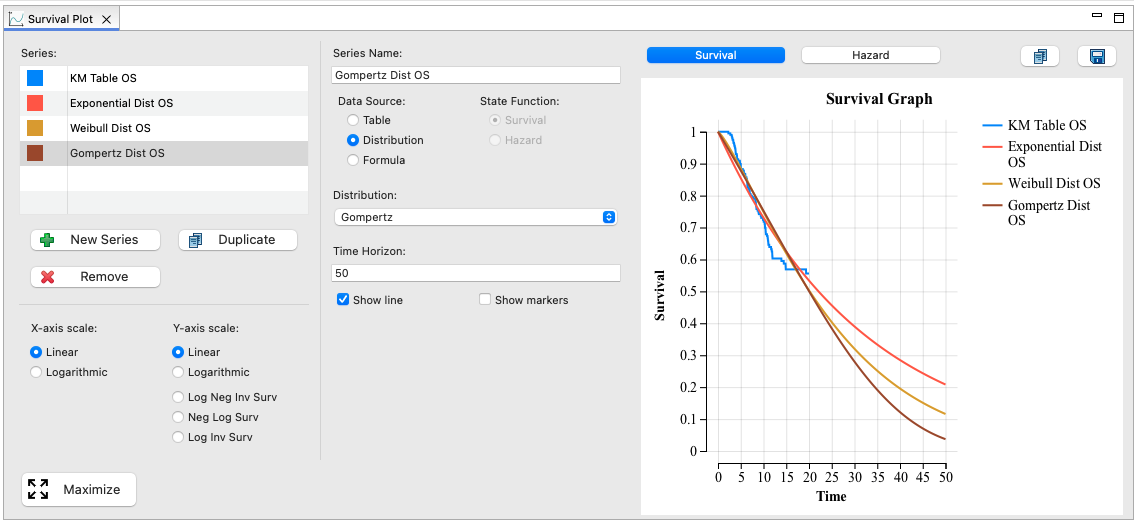
Let's consider that we have three distributions that were generated from regression analysis of the original survival data - one Exponential, one Weibull and one Gompertz (named as such). With the instructions below, we will add the Exponential distribution, but the same instructions could be used to add the other two.
-
Click the New Series button.
-
Enter the Series Name Exponential Dist OS.
-
Choose the Data Source option Distribution.
-
Choose the State Function option Survival.
-
Select the Distribution Exponential from the dropdown menu.
-
Note that this is a specific Exponential distribution despite the generic name.
-
-
Change the Time Horizon to 50.
If repeated for the Weibull and Gompertz distributions, the survival plot would include the original Kaplan-Meier table plus three distributions approximating and extrapolating survival.
45.3.3 Add a Series for a Hazard Table
Let's consider that we converted the original survival data to hazards with the Survival to Hazard Converter. Then we smoothed out the unstable hazards with the Hazard Editor, resulting in the hazard table tbl_Hazard. Now we will add the hazard table to the Survival Plot.
-
Click the New Series button.
-
Enter the Series Name Table Hazard OS.
-
Choose the Data Source option Table.
-
Choose the State Function option Hazard.
-
Select the Table tbl_Hazard.
-
Leave the Time Horizon as 50.
There are now 5 series in the Survival Plot - the original Kaplan-Meier data, plus 4 survival estimates that forecast into the future.
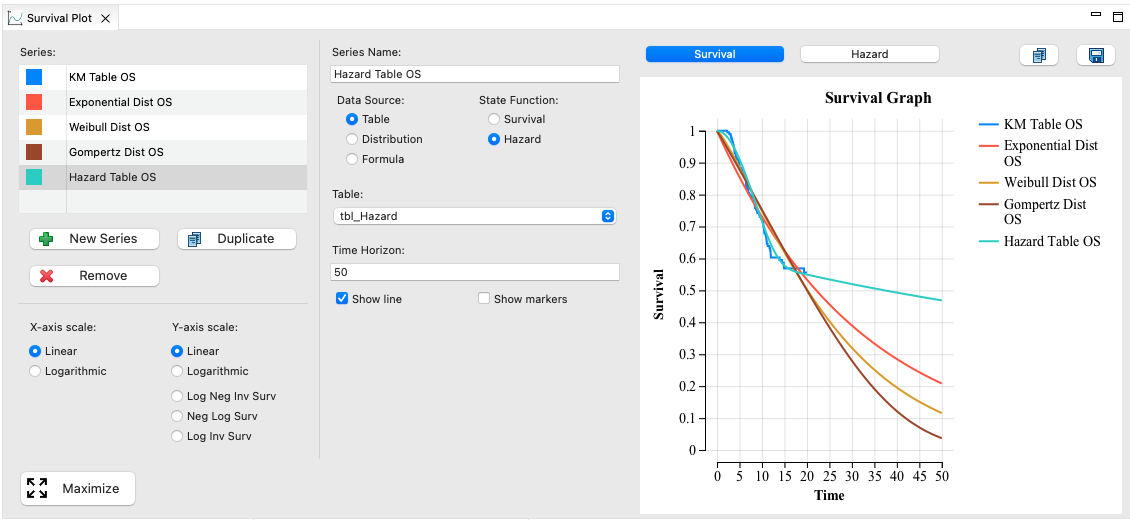
We can examine those survival curves graphically and use our best judgment as to which is the most accurate and appropriate for our model.
Note that the hazard table series maintains a low decline because the original Kaplan-Meier data flattened out as well, suggesting a curative nature to the treatment. However, this would likely require the addition of background mortality to account for an aging population.
45.3.4 Hazard Plot
It is often useful to examine Hazard Profiles for our survival estimates to see how health risk changes over time.
Click the Hazard button above the plot to see the hazard profile for each series.
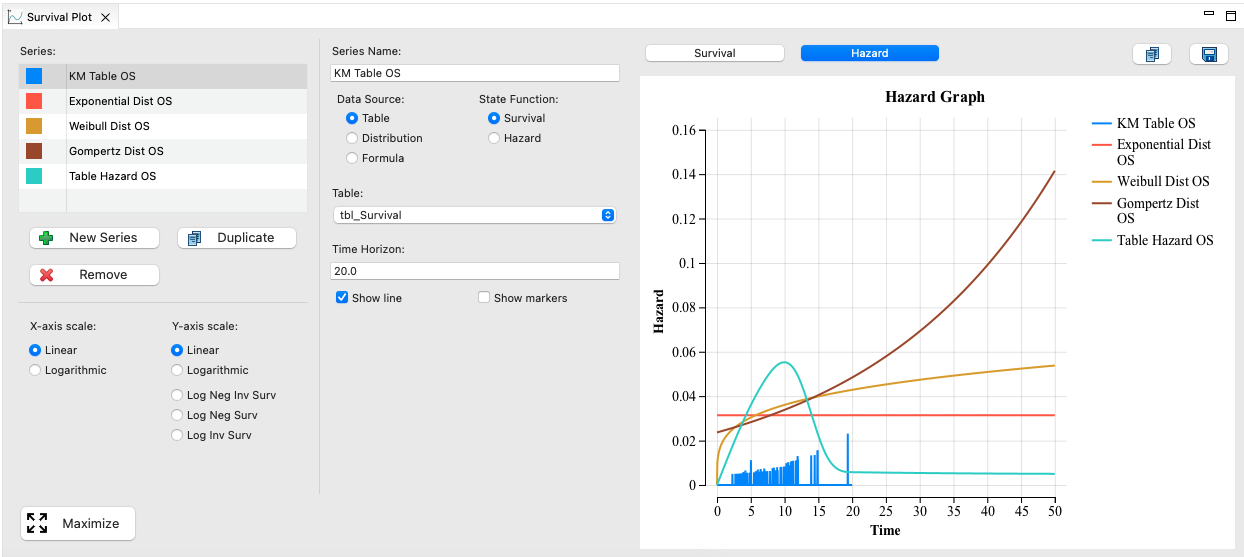
Note that by its nature the Gompertz distribution includes risk that increases quickly over time, while the Exponential distribution represents fixed risk and the Weibull distribution represents slowly increasing risk.
The hazard profile for the original Kaplan-Meier table is unsteady based on the distinct points in the table and a limited data set size. The hazard table profile reflects the smoothing out of changes in hazards performed with the Hazard Editor.
45.3.5 Plot Options
There are a few control options to change the display of the plot. These are described in the prior section Survival Plot Controls.
